Successful momentum trading is based on spotting the direction in which the majority of the market is heading, and the 52-week high strategy is a relatively reliable indicator of such moves.
It goes against the intuitive approach of many novice traders, which makes it worth exploring. It also stands out from other technical analysis tools in being more about where the price might go rather than where it’s been.
The 52-Week High Strategies Explained
The basic principles of the 52-week high strategy is often applied to stocks, but can just as well be applied to any asset or market as they come down to a simple and easy-to-access price point. It involves taking the high price point over the last 12 months as a key indicator.
Rather than treating a price high point as a trigger to sell out of a position to lock in profits, the 52-week high strategy involves buying into or buying more of a position. The strategy is based on the fact that the new price high signifies the potential for further future gains via price discovery.
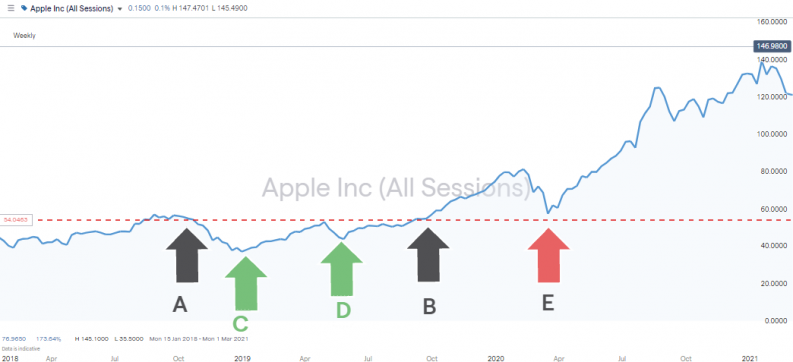
Apple Inc Shares – Weekly Price Chart – 52 Week Trading Strategy
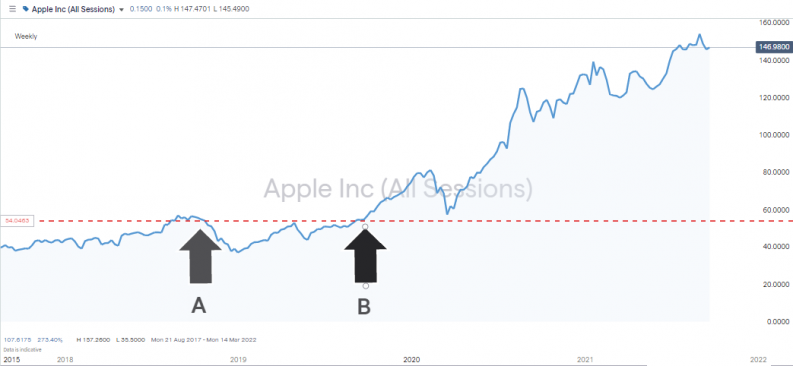
Source: IG
Arrow A marks the price for Apple in October 2018, being in the region of $56. The stock traded sideways, or more importantly, below that price level for 52 weeks before, in October 2019, it broke above the level.
Apple Inc Shares – Weekly Price Chart – 52 Week Trading Strategy
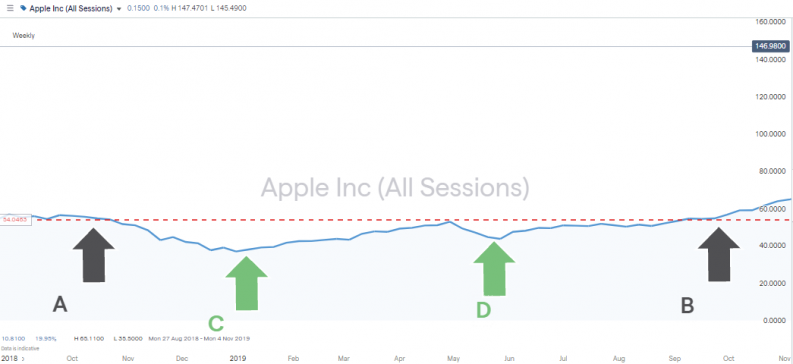
Source: IG
Anyone who bought at arrow C or D may lock in a profit. Their pullback strategy has paid off – but by flipping things around and taking a longer-term view, arrow B can be seen as a trigger to buy, not sell.
Apple Inc Shares – Weekly Price Chart – 52 Week Trading Strategy
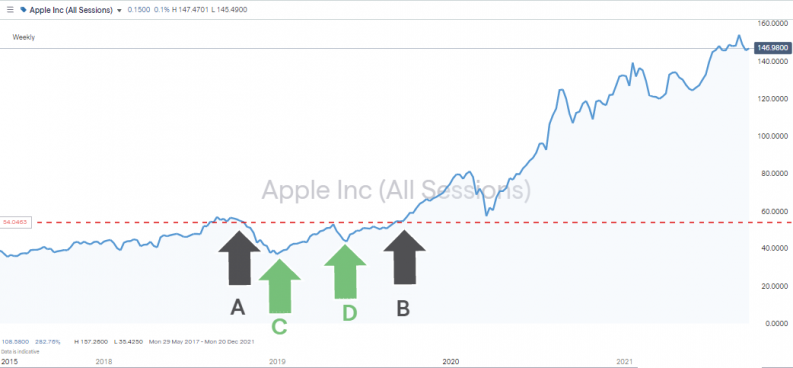
Source: IG
Experienced traders treat the breakout above a 52 week high to be a game-changing event. At that point, past performance is still factored in but becomes secondary to what could lie ahead.
In the Apple example, there is an onward share price surge after arrow B. Interestingly, from a risk management perspective, the pullback sees price action retreat toward the 52-week high trade entry point but not touching it. As is often the way with technical indicators, what was once a resistance level turned into a support level.
Apple Inc Shares – Weekly Price Chart – 52 Week Trading Strategy
Source: IG
In less than 12 months, investors who applied the 52-week breakout strategy had more than doubled their money.
Variations of the 52-Week Strategy – Breakouts Either Direction
- With markets being neutral in terms of upward or downward bias, the same principles can be applied to 52-week lows.
- If your stock is not a ground-breaking growth stock, then sideways price movement within a range of the 52-week high and low could be more likely.
- When the price reaches the 52-week high resistance level, there can be significant resistance to it breaking through. With stocks, in particular, some investors wait for the closing price to be above the 52-week high closing price.
YOUR CAPITAL IS AT RISK
Trade Entry and Exit Rules & Stop Losses
Some broker platforms offer client alerts relating to stocks that are breaking out of these highs. Finding the optimal time to enter a trade and ways to manage downside risk is the secret to tilting the balance in your favour.
Trade Entry Points
As mentioned, many look for the closing price rather than an intraday price to confirm the move. Other indicators can be factored in as well. The key is to gather data over time to determine which variations of the strategy work best in the long run.
Do SMA Simple Moving Averages Trigger an Entry?
If the 20-day SMA is above the 50-day moving average, and the 50-day average is, in turn, above the 100-day moving average, then this is a sign of bullish price action. It demonstrates that the price has been moving upwards in an orderly manner for some time, which suggests it’s well-positioned to continue its move once the 52-week high is breached. (20D SMA gt; 50D SMA gt;100D SMA).
Apple Inc Shares – Daily Price Chart – 52 Week Trading Strategy – Trade Entry Points
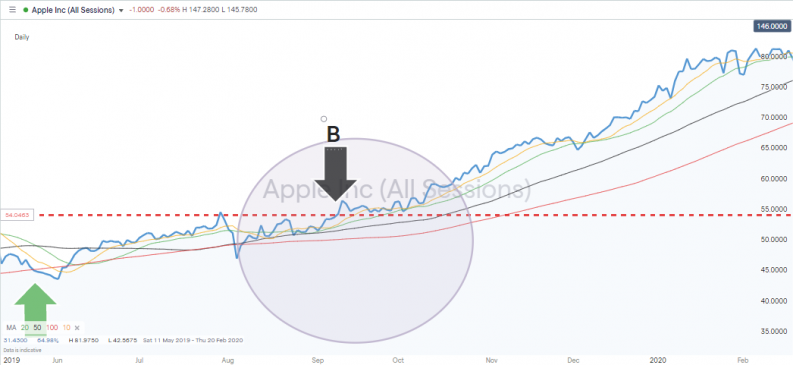
Source: IG
What About the Stock Trading Above the Ten-Day SMA?
The longer-dated SMAs indicate how long momentum has been building, but a breakout requires renewed impetus. If a stock is trading above the average price of the last ten days, then buying pressure is building.
In the above daily price chart, the SMA indicators are aligned to support buying Apple stock as it breaks the 52-week high.
Trade Exit Points
As the 52-week trading strategy is based on momentum, the SMA’s can also be a key indicator of when to exit positions. In the example of Apple, there are two moments when the price falls below the daily 20 SMA. The first exit point would have locked in some profits, but there is room for FOMO to kick in as the price quickly recovered and pushed on higher.
The second SMA-triggered exit point would have represented a much closer to an optimal exit point. Price cuts through the 20 SMA on the 30th of January 2020 at $77.76 per share, and by the 23rd of March, the price has fallen to $57 per share – a 25.77% fall in value.
Apple Inc Shares – Daily Price Chart – 52 Week Trading Strategy – Trade Exit Points
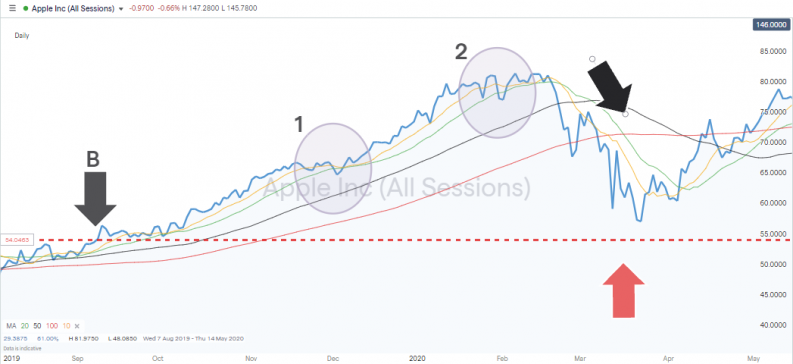
Source: IG
Both exit points 1 and 2 would have been opportunities to lock in some gains and avoid the subsequent sell-off.
52-Week Strategy – Stop Losses
The obvious place for stop losses is just below the 52-week high price level. This is based on the one-time resistance level turning into a significant support level once breached. However, from experience, the price will generally probe just below those levels before taking off, so you may want to place it slightly lower.
Other options include setting stop losses below the 20, 50 and 100 SMAs. Momentum is the fundamental principle in play, so moving averages make an obvious choice in terms of risk management.
Using trailing stop losses is also an option. As the price moves higher, stop losses set below the 10-day SMA would provide an automated exit point, meaning the trade could be left to run.
The ability to set a tight stop loss and let winners run means that if 50% of the trades are successful, then aggregate returns should be positive – the sum of returns from winners being greater than the sum of losses on losing trades.
Advantages of Using 52-Week Trading Strategies
A strong long-term indicator: 52-week highs are strong indicators because they are based on long-term trends. They are regarded as strong indicators of resistance and support.
Highly traded: The 52-week highs are a much-watched indicator.
Based on real-time price action: 52-week strategies are not immune from this criticism, but they stand out as providing a clear indication of where the price is heading, not just where it has been.
A target for hedge funds: The 52-week high trading strategy is a popular target for big algo-based hedge funds, which means there is potential for a lot of cash getting behind a trade.
Easy to follow: The 52-week strategy is simple to understand and follow. The principles of riding momentum until a specific trigger point is a straightforward one.
Broker alerts: Good brokers support the strategy by providing built-in 52-week high indicators. This can take some of the leg work out of the analysis needed to spot them.
Trading with the trend: If you make the right call on an upward breakout, you’ll be trading with market momentum, and when that happens, the gains can be substantial.
Disadvantages of Using 52-Week Trading Strategies
Primarily stock-focused: Breakouts of long-term trading ranges can be applied to all asset groups, but the 52-week high strategy focuses more on stocks.
Cannot be used with other indicators: 52-week highs are not easily applied to other metrics such as RSI. They can be used, but as they typically focus on price, only a few participants will be trading off breakouts from other indicators.
Vulnerable to market shocks: As the strategy is biased to long positions, market shocks, such as geopolitical events, can lead to a basket of 52-week high positions, triggering stop losses all at once.
Time-consuming: While technical analysis, namely price action, is at the heart of the strategy, fundamental factors need to be considered. It can take time to keep up with news and analysis of stocks, and if you’re building a sizeable portfolio, that extra commitment needs to be considered.
YOUR CAPITAL IS AT RISK
Other Indicators That Work Well With 52-Week Indicators
52-week strategies are great at providing a clear indicator of a potential break out, but all indicators benefit from being used in conjunction with others. Whatever your trading style, incorporating signals from the below strategies can improve trading performance.
It is also worth questioning the chosen time frame. The 52-week high is the go-to metric representing a calendar year, but applying different time frames is another option. Popular other timeframes include one month and one week, and day traders even use the one-day window to spot trading opportunities.


