
The world’s leading cryptocurrency, Bitcoin (BTC), sent a bullish, intermediate-term trend momentum shift signal over the weekend, as the 50-day Simple Moving Average (SMA) crossed above the 100-day SMA! This sets up a far more bullish forecast for BTC/USD into February, Q1, and indeed for 2023.
eToro is a multi-asset investment platform. The value of your investments may go up or down. Your capital is at risk.
BTC Sees Bullish Trend Momentum Shift
Another leap higher over the weekend for Bitcoin, the third successive jump over a weekend, to push to yet another new multi-month high. Moreover, this surging advance for BTC also produced a significant, intermediate-term bullish technical signal on the charts. The BTC/USD 50-day SMA crossed above the 100-day SMA, which is often viewed as a technical analysis statement of bullish change in the intermediate- to longer-term momentum outlook and trend.
Top Broker Recommendation
- IG Top-tier regulation – Read our Review
- eToro Wide range of instruments available to trade – Read our Review
YOUR CAPITAL IS AT RISK. 76% OF RETAIL CFD ACCOUNTS LOSE MONEY
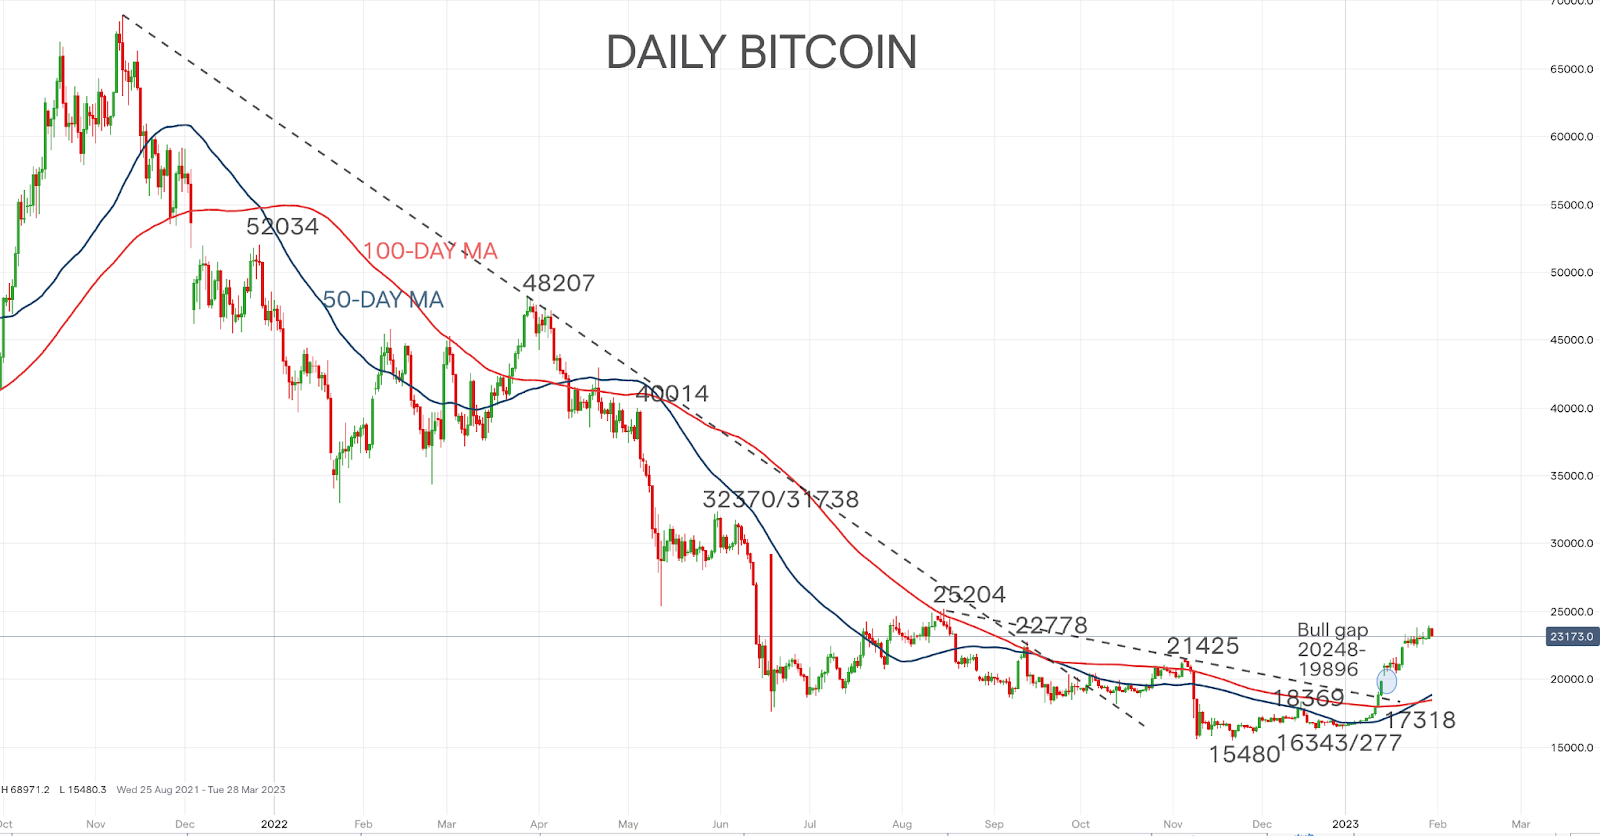
This bullish technical analysis statement with both MAs rising was the first such bullish crossover for Bitcoin since October 2020, which saw the market then go on a bull run from around the $12K level up to the all-time high, just below $65K. It should be noted that there have been two other positive crossovers since then for BTCUSD, one in August 2021, which did see further upside and one on April 2022, which did not produce gains, BUT in both these instances, the slower, 100-day SMA was falling at the time, NOT rising!
Upside Price Risks
On top of the aforementioned bullish signal, BTC has previously overcome key Dow Theory swing peaks at 21425 and 22778. This reinforces both short- and intermediate-term bullish forces to aim higher into February towards the August 2022 swing high at 25204.
The risk is for still further Bitcoin gains into the first quarter, to aim for the chart resistance cluster at 31738/32370, with overshoot risks towards 40014. The threat for the year is even higher, maybe to challenge 48207 and even 52034!
Downside Correction Threats
A push back below 22313 for BTC would only damage the very immediate, short-term bullish bias for a correction down towards the bull gap at 20248-19896. Only a close of this Bitcoin support gap would set a more negative theme again to aim BTCUSD at 17318, even back for 16343/277 and possibly the bear market low at 15480.

eToro is a multi-asset investment platform. The value of your investments may go up or down. Your capital is at risk.
