Expert traders are often able to interpret the true meaning behind these price gaps and capitalize on their occurrences as opportunities for investment. When used properly, price gaps offer favorable trade set-ups for experienced investors and open the door to substantial profit potential for those interested in active trading.
For some background, it’s important to understand that trading gaps occur due to unexpected changes in the underlying fundamental and/or technical characteristics of an asset. As an example, let’s assume a company releases its earnings report and the results are significantly higher than market analysts expected. In many cases, companies will release earnings before the market opens. Essentially, this means investors do not have the opportunity to buy the stock immediately after the favorable earnings report is released.
As a result, it wouldn’t be surprising to see share prices gap higher once the market eventually opens and investors have a chance to “catch up” and react to the new information that has become publicly available. Ultimately, this means the price of the stock opened the morning session at a higher valuation relative to where it closed on the previous day (thereby leaving a price gap on the charts).
Price Gap Formations
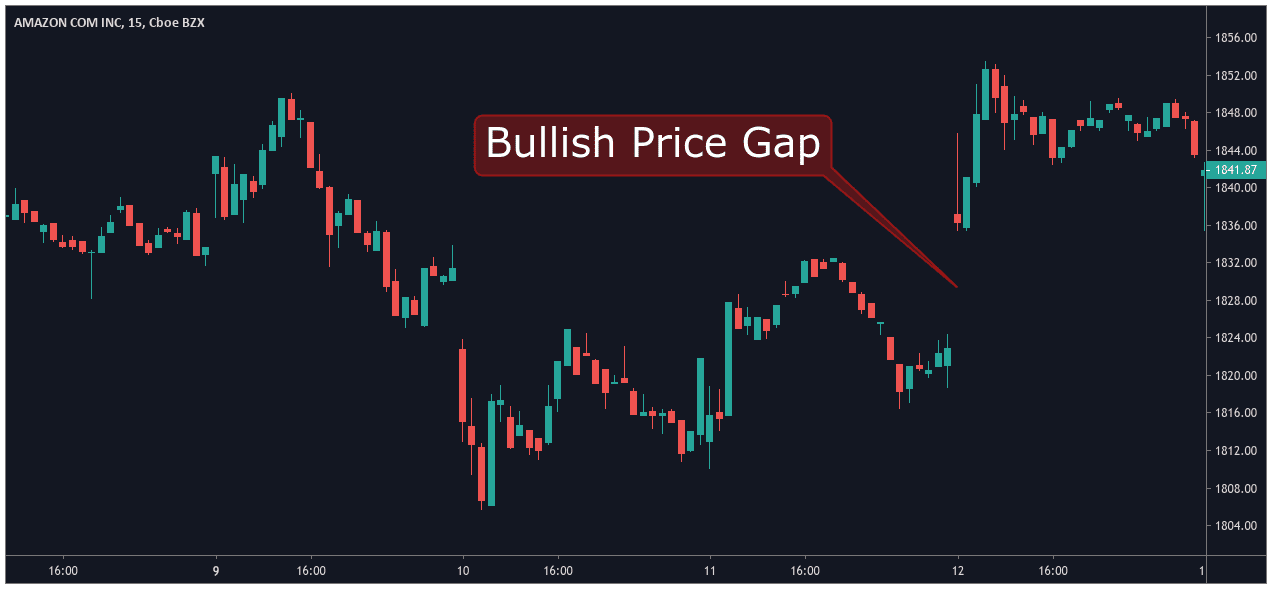
Next, we will look at two examples of how these price gaps would appear on a price chart. First, we can see how positive changes in market perception can force prices to move sharply higher (creating a bullish price gap):
Second, we can see how unexpected changes in market perception can force prices to move sharply lower (creating a bearish price gap):
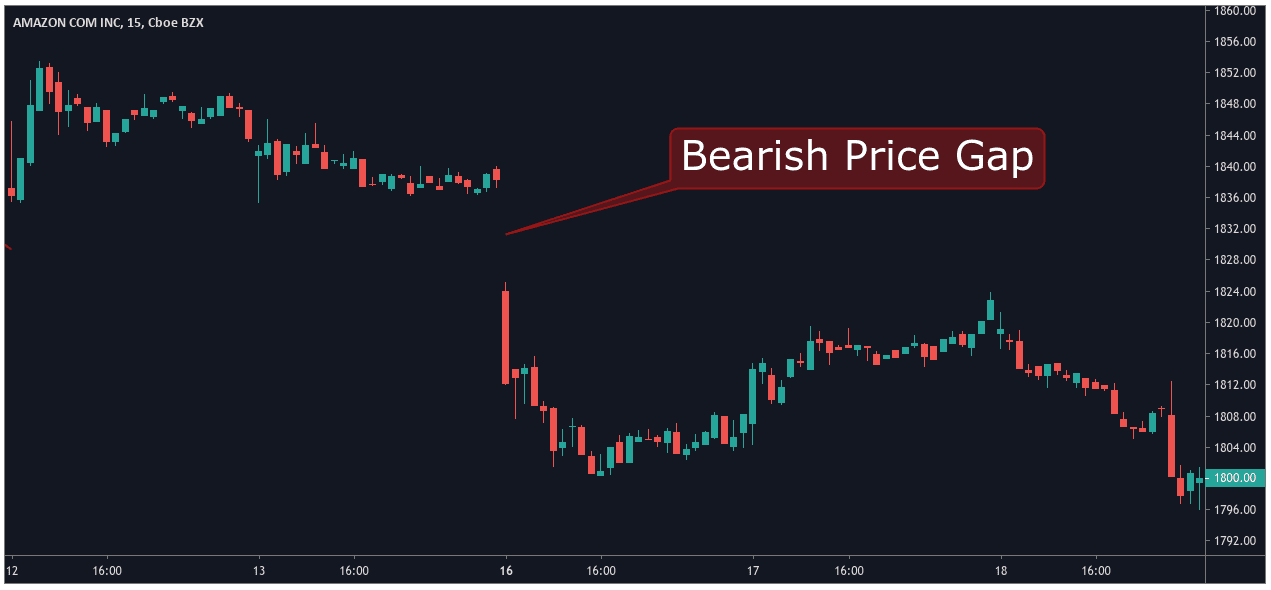
In both cases, asset prices display a gap in the market’s normal price patterns (which tend to be much more fluid in their transitions). These types of price gaps occur in all trading markets (i.e stocks, forex, cryptocurrencies, and commodities). However, price gaps tend to be much more common in volatile asset classes which are characterized by low liquidity levels.
This latter point is particularly important in foreign exchange and cryptocurrency markets, as traders will often encounter instances where bid/ask spreads widen significantly. In many cases, this can between market sessions or just before a major economic report is released. Whenever there are significant disruptions in the general order of the market, price gaps quickly become visible on the charts. However, it should be understood that price gaps can appear in all asset classes. In some cases, significant market events or macroeconomic developments can actually cause price gaps to appear in several different asset classes at the same time.
Useful Pages:
Compare Stock Brokers | Compare Forex Brokers | Compare CFD Brokers
Price Gaps: Understanding The Basics
Of course, every market environment is different —and not all price gaps exhibit the same characteristics. As a result, market price gap events are generally classified into four different groups:
- Common Gaps are seen when the session’s opening price is sharply higher or lower relative to the closing price of the previous session. (The two prior chart examples shown above fall into this category).
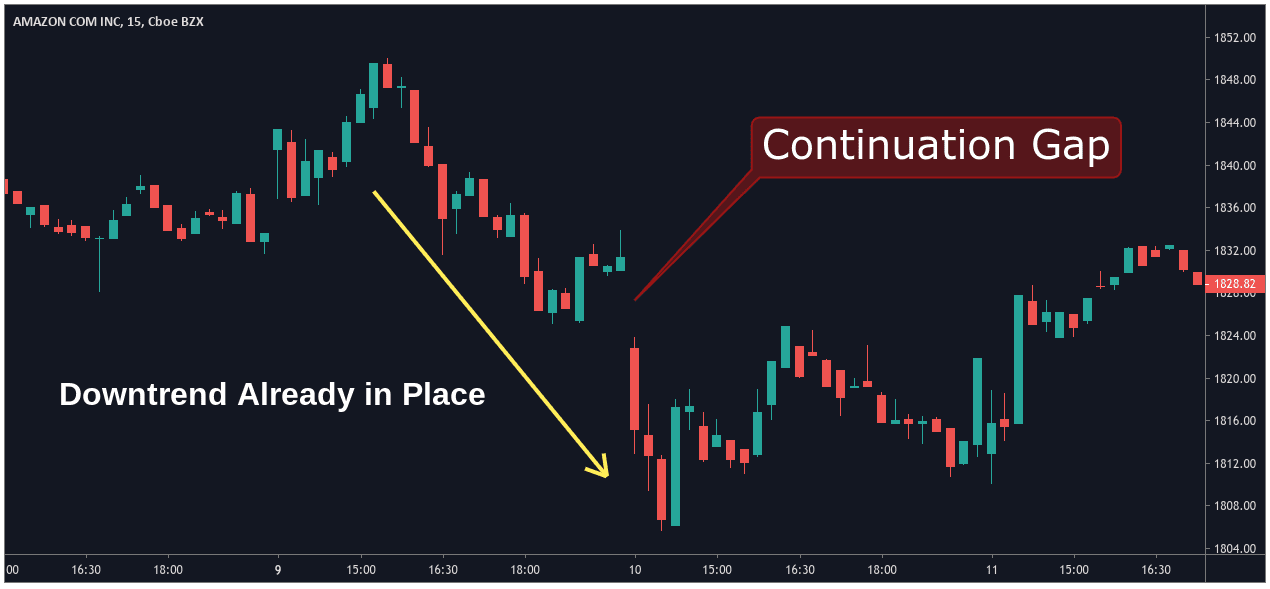
- Continuation Gaps (also referred to as “runaway” gaps) occur in the midst of a larger price trend. These gaps signal a rush of sellers or buyers that are now trading with a shared belief in the stock’s future direction. Market trades that are based on Continuation Gaps often follow many of the same rules that are used in trend-trading strategies.
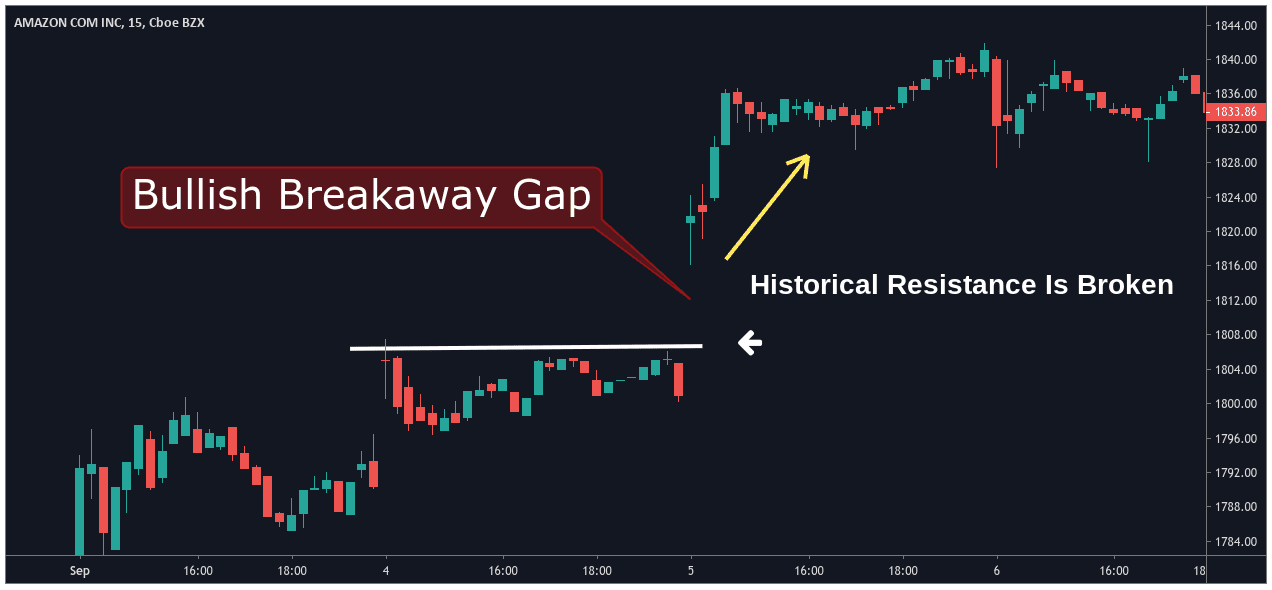
- Breakaway Gaps occur when market prices gap below support levels or above resistance levels. These events usually require above-average trading pressure that suggests market sentiment is changing. When prices gap above resistance levels, trend projections are bullish (and long positions can be established). When prices gap below support levels, trend projections are bearish (and short positions can be established).
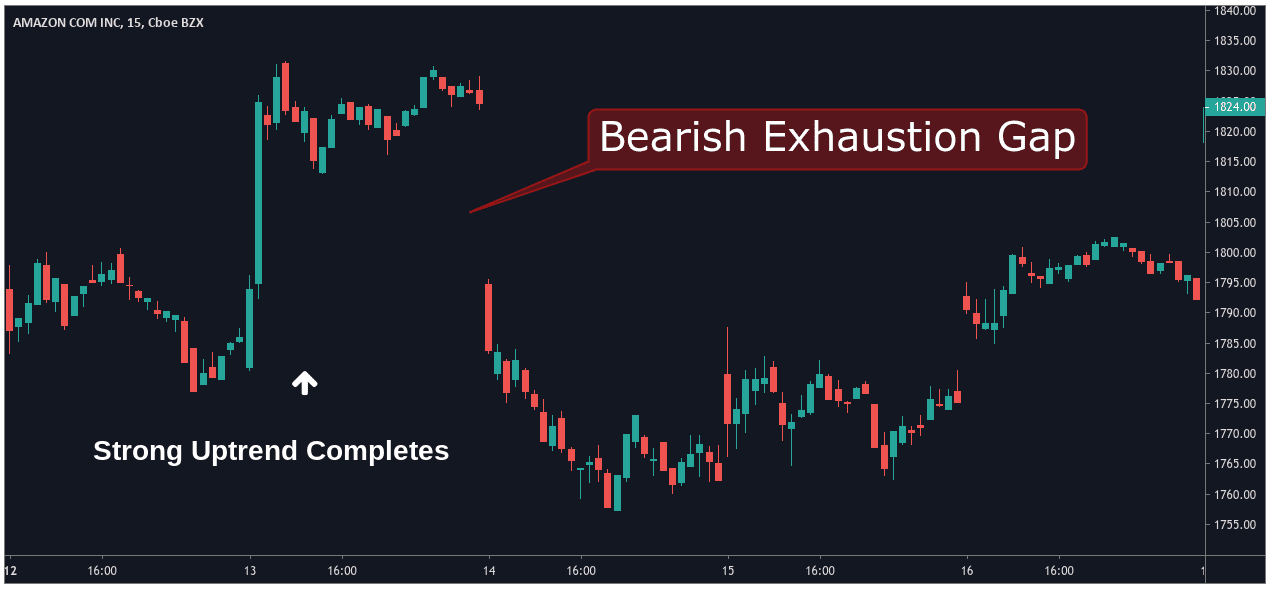
- Exhaustion Gaps mark a change from downtrend to uptrend (or vice versa). This reversal signal generally has three characteristics: rising volume and a significant upward or downward break in prices. The implication of an exhaustion price gap is that most buyers/sellers have finished their activities and there aren’t enough orders left in the market to continue the trend. Exhaustion Gaps often occur when traders “buy the rumor, sell the news”, as a majority of the market’s short-term scalpers enter trades and then quickly close their positions for small profits.
Filling Price Gaps
In many cases, a gap in the market will eventually be filled, which means that asset prices have moved back to their original levels (before the gap occurred). These types of events are quite common and they occur for the following reasons:
- Market Exuberance: Initial spike/decline might have been too optimistic/pessimistic and asset prices are in need of correction. This type of reaction can cause prices to move back to their original levels as the market attempts to re-enter a period of equilibrium.
- Technical Support/Resistance: When market prices move sharply (up or down), the lack of clear support/resistance levels can cause prices to gravitate toward their previous values. This is often where a majority of the markets “buy” and “sell” orders are resting, so price breaks above or below these levels can often be quite forceful.
- Chart Patterns: Chart patterns help in classifying price gaps and can help traders to predict whether or not a market gap is likely to be filled. Exhaustion gaps tend to be the most likely candidates for a “gap-filling” event because they occur near the end of a market trend. Conversely, breakaway and continuation gaps are much less likely to be filled because they confirm the broader direction of the most recent market trend.
In cases where market gaps are filled on the same trading day, traders will often refer to the event as “fading the gap.” For example, if we assume that a company releases an excellent earnings report and market investors start to buy at a furious pace, the stock may form a price gap in the upward direction when the market opens.
Now, let’s assume that the same stock retraces those gains as the session progresses. Perhaps, further details in the report were less optimistic or maybe traders were just interested in taking their initial profits. If bullish investors start selling their positions (and yesterday’s closing price is ultimately reached), the bullish trading gap would then be filled and the formation will be completed.
Gap Trading: Basic Rules To Remember
Fortunately, there are several ways for traders to benefit from price gaps in the market. Some strategies are more popular than others, and many traders will buy an asset when fundamental or technical chart factors suggest a price gap is likely to occur during the next trading day. Other traders might choose instead to fade gaps (by trading in the opposite direction) after support/resistance levels have defined a clear price high or price low for the session. As a result, it can be said that there is no single approach that can be used to trade price gaps in all market environments.
For short-term traders, here are some of the basic factors to keep in mind when trading market price gaps:
- Continuation Gaps and exhaustion gaps project prices are likely to move in two opposing directions. This is why traders must make sure to correctly classify the type of price gap that has developed before entering into an active position.
- Once an asset has started filling a price gap, it’s unlikely to stop. This is because there is generally no clear support or resistance level nearby to contain prices.
- Short-term investors tend to exhibit the highest levels of market exuberance, so be wary of chasing price gaps once the bulk of the trending move has already been established. Traders that “chase the gap” often find themselves dealing with losing positions.
Price Gaps and Market Volume
From a strategic perspective, it’s also important for traders to make sure that they watch for any new changes that develop in market volume. In general, Breakaway Gaps should be accompanied by high volume, while Exhaustion Gaps should be accompanied by low volume.
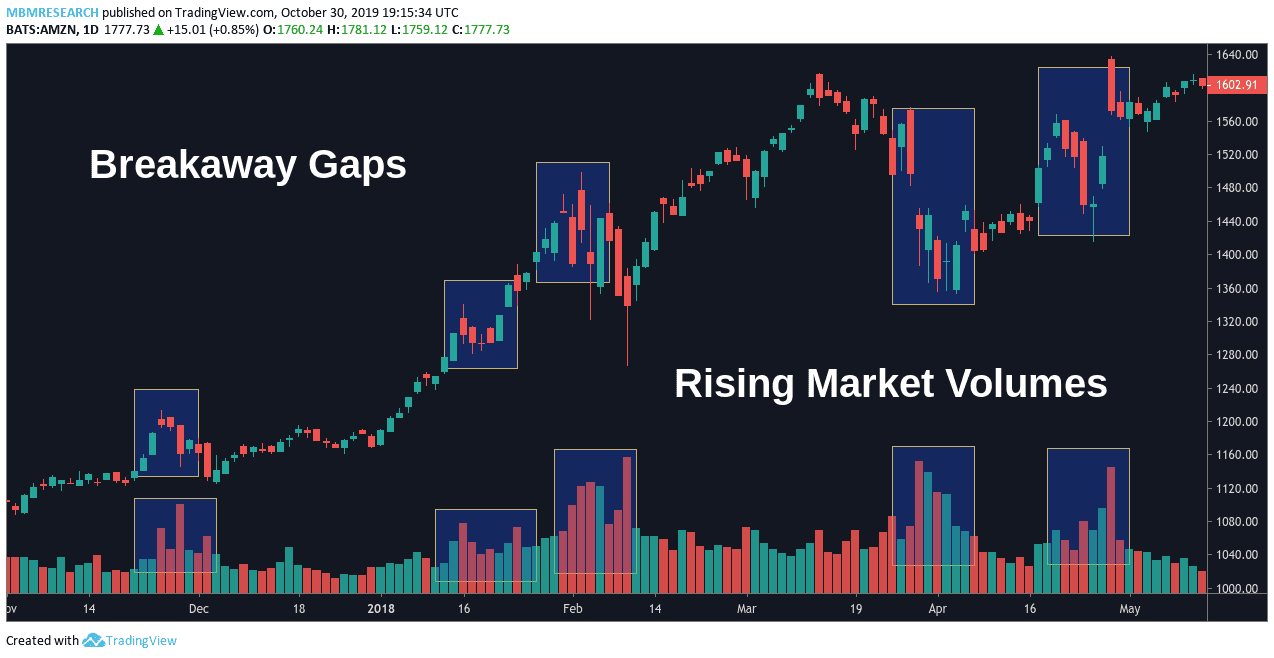
In this chart history, we can see that Breakaway Gaps tend to form in conjunction with rising market volumes. Remember, these price formations will occur as major support or resistance levels are broken. Thus, it stands to reason that a larger number of traders would be required in order to overcome the buy/sell orders that tend to be placed near these important price locations.
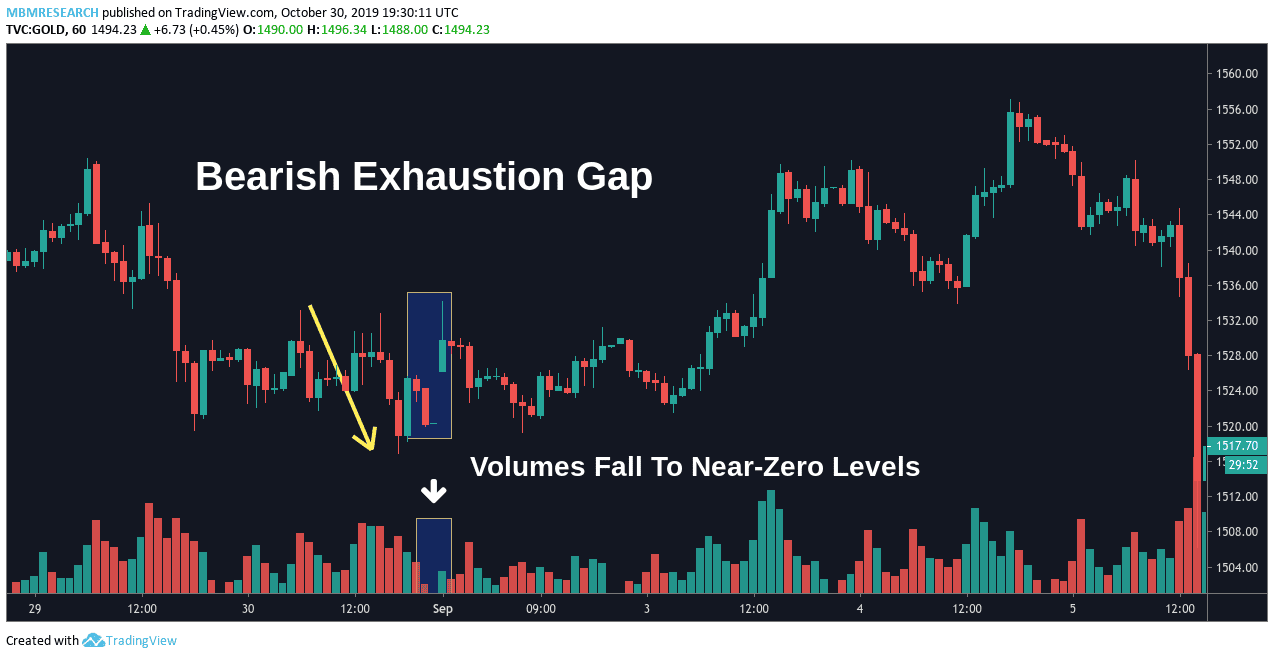
In contrast, an Exhaustion Gap will occur as market volumes fall to near-zero levels. In the chart graphic shown above, we can see that a downward move in prices is quickly followed by an upward gap in valuations. To explain why these types of events occur, we must understand that cyclical price trends reach a point of exhaustion whenever a clear market majority disappears.
In the chart history above, the market majority is bearish and asset prices are sent in the downward direction. However, as the majority of the market’s bearish traders leave the market, their “sell” positions are turned into “buy” positions when their trades are closed. As these artificial “buy” orders begin to flood the market, an Exhaustion Gap forms while market volume drops.
Trade Protection: Stop Loss Levels
Gap formations tend to happen most often in market environments that are characterized by high levels of price volatility. For these reasons, gap trading strategies require protective stop losses. Essentially, the importance of these protective techniques is even more important (when compared to trading styles with a slower approach) because the potential for loss is greater.
In our next gap trading chart, we can see a market environment in which prices begin to enter a downtrend before retracing upward. Once investors notice the broadening divergences that have developed between the dominant market trade and the current market valuation, a massive round of sell orders quickly forces asset prices lower.
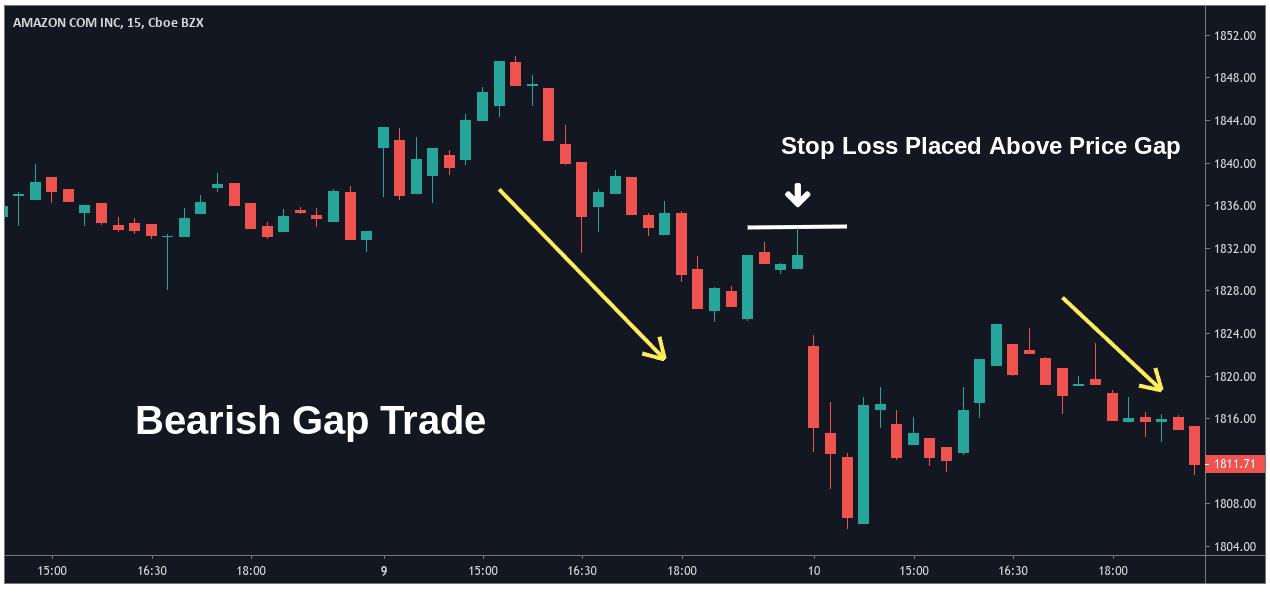
An event like this qualifies as a Continuation Gap, and it suggests the broader downtrend is likely to continue. As a result, traders could be able to establish short positions with a stop loss placed above the last resistance level which preceded the price gap (represented by the white horizontal line).
Why should traders be willing to close the trade at a loss if prices reach this level? Essentially, the gap formation would be eliminated if markets reverse higher and trade above the previous resistance zone. Once the bearish reasoning behind any short trade is invalidated, the probability of generating profits is significantly reduced. As a result, it makes sense to exit the position and look for opportunities elsewhere in the market.
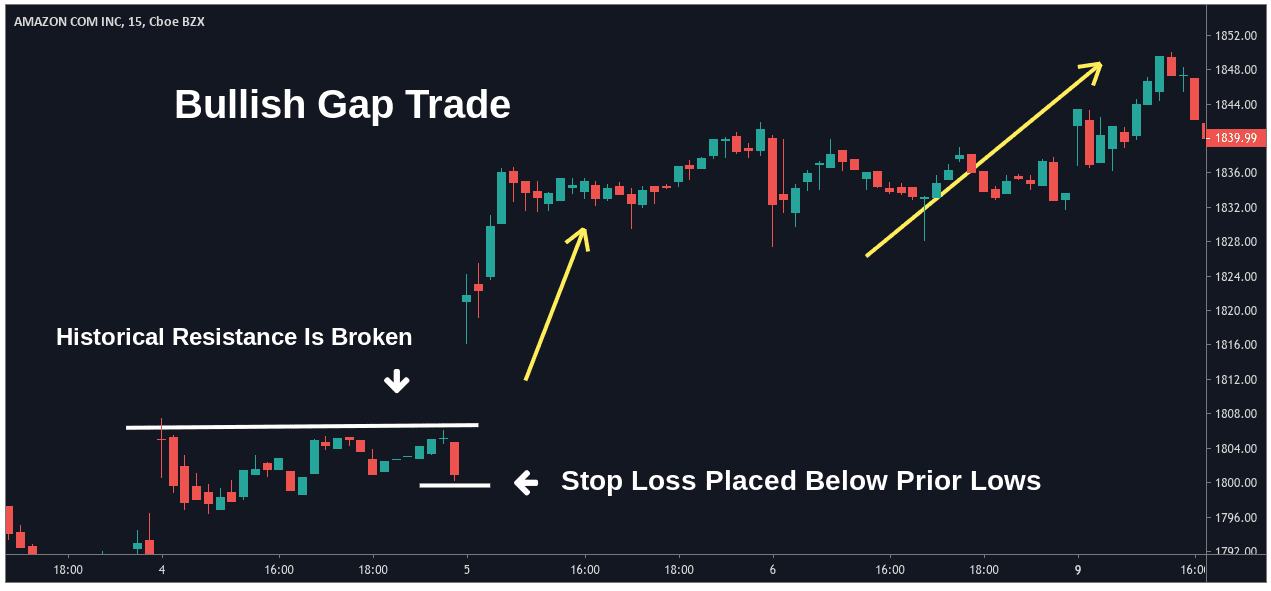
In our second gap trading example, we can see a bullish scenario which could be used to establish long trades. In this case, a bullish Breakaway Gap has occurred after a sideways trading range saw prices break above resistance. The severity of the buying activity was strong enough to gap higher after breaking through range resistance, and this suggests that additional upside follow-through is likely. In a scenario like this, stop losses could be placed below the prior range lows and moved to the break-even point once gains in the trade equal the initial risk parameters.
Investors monitoring the underlying factors that result in price gaps are able to accurately identify the type of gap structure that has occurred and trade its outcome with a rate probability of success. Price gaps have a significant probability of experiencing the projected follow-through and this can lead to profitable positioning once protective stop losses are established. It is often best to set stop loss levels above key resistance levels, below important support levels, or to use a predetermined risk percentage (i.e. -8% on each trade).
Price Gap Formations
To better visualize how these concepts unfold during real-time market conditions, let’s take a look at a basic gap trading scenario while taking special note of changes in market volume and areas where stop losses might be placed in these situations.
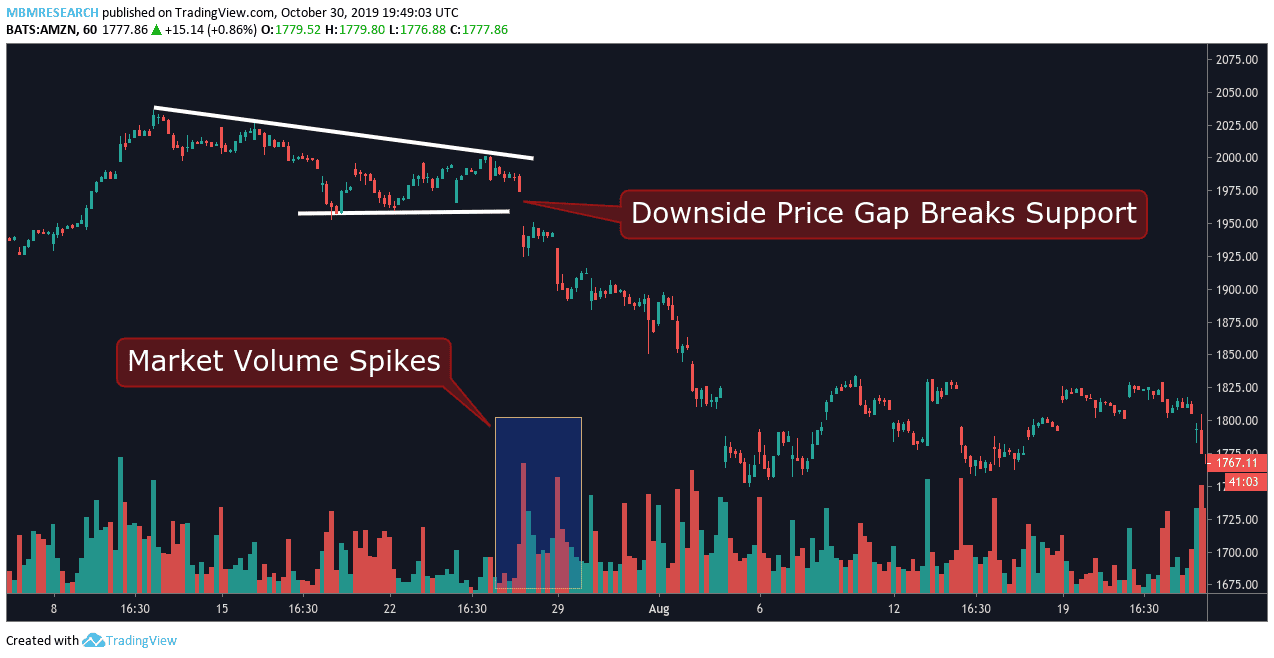
In this example, we can see that asset prices have formed a Descending Triangle based on a triple-bottom support zone. Eventually, market conditions force a downside break through this support zone and a Breakaway Gap price formation becomes visible.
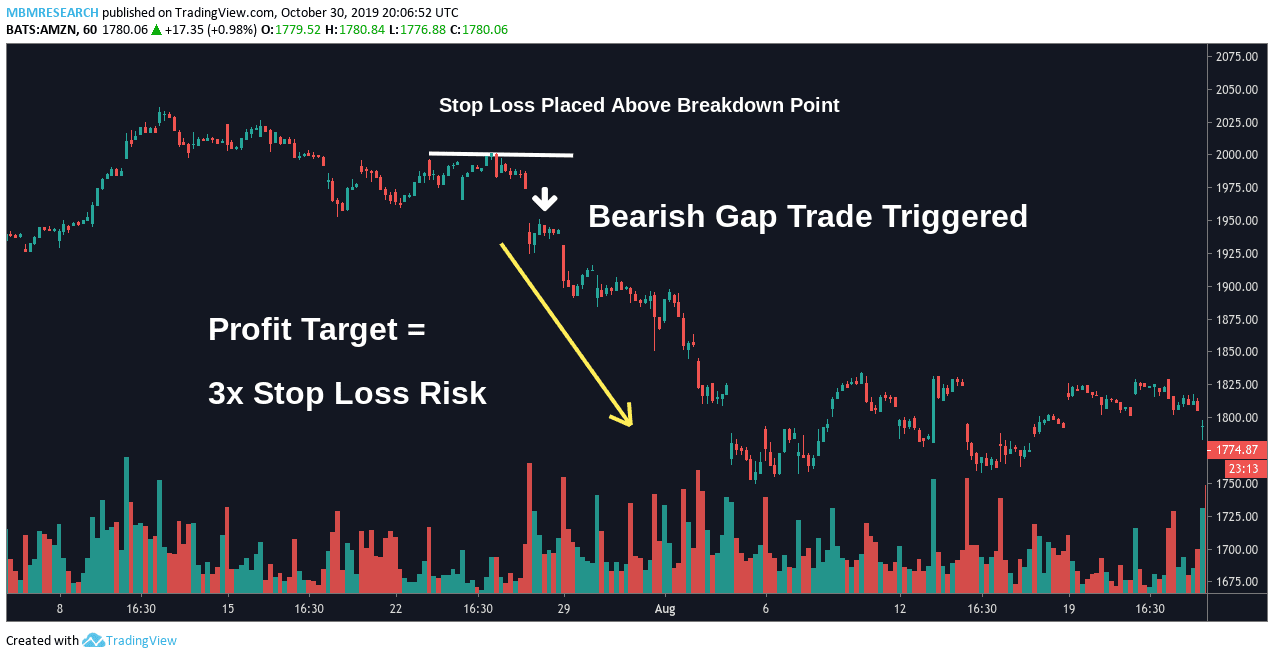
Now that the dominant market direction is clearly bearish, gap traders might initiate short positions. The trade entry point can be found at the white downside arrow and the protective stop loss should be placed above the breakdown point that caused the initial price gap (white horizontal line).
To determine the profit target on the trade gap traders will multiply the amount of risk exposure by a factor of 3x. This will create a risk-to-reward ratio of 3:1 and produce a favorable balance that is designed to achieve long-term profitability for the trading strategy. Remember, price gap formations tend to occur during market environments characterized by rising volatility that can quickly trigger stop losses. However, when risk-reward ratios are structured with a 3:1 favorability, long-term profitability does not necessarily require that a trader is successful in a majority of the positions that are initiated.
Overall, traders are looking for scenarios in which the market is signaling the presence of new information that will affect the future prices of an asset. Gaps offer technical traders a visual representation of this new data without conduct fundamental analysis of any given financial instrument. Gap formation can occur in all asset classes, however, their structural tendencies share many common characteristics that traders can use when constructing a profitable market strategy.
Real-Time Trading Example: Continuation Gap Strategy
In the following real-time trading example, we can see a bullish Continuation Gap give us a buy signal in Bitcoin. Indicator reading are at neutral levels, so this shows that the prior bullish uptrend is still in place. As a result, Bitcoin prices are likely to move higher and generate profits for long positions.
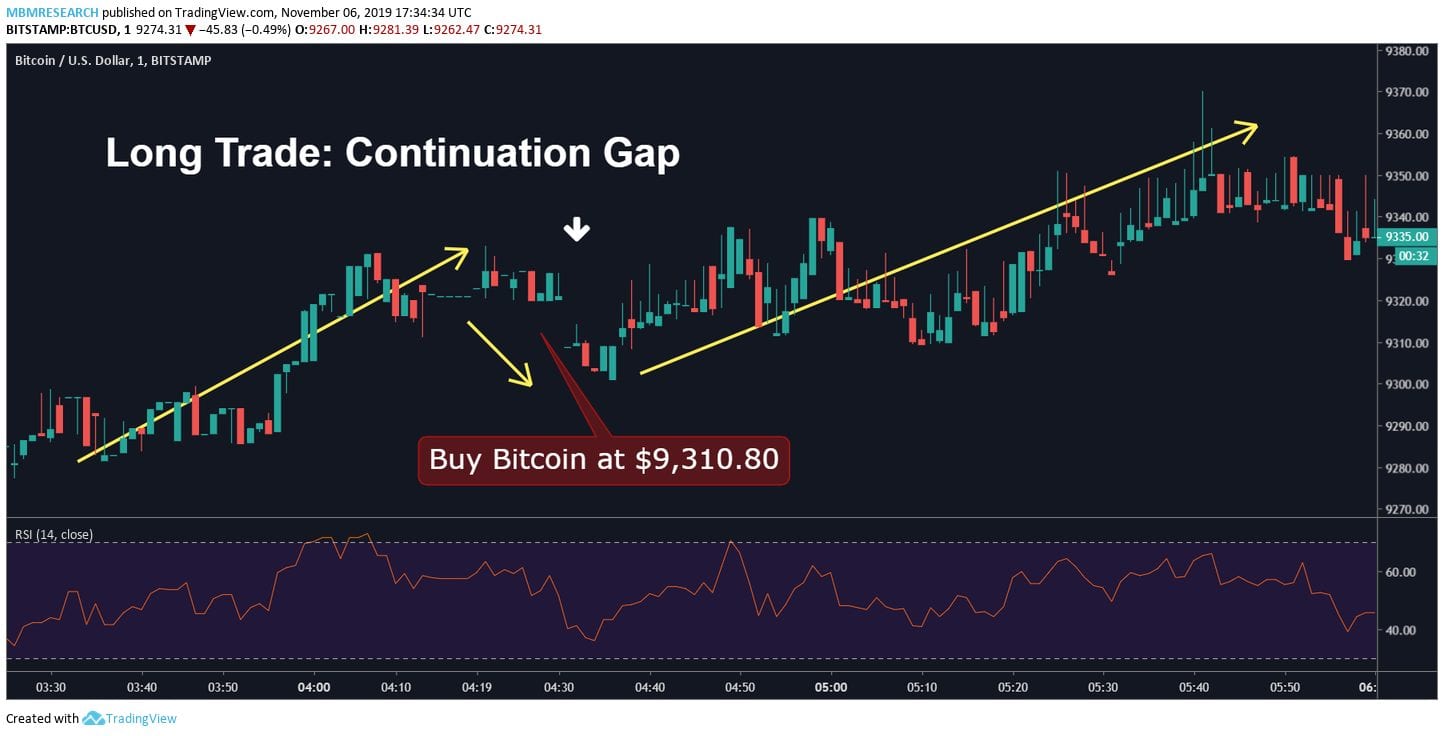
Traders should set stop losses below the prior price lows at $9,285.10 in order to protect the position from extensive losses. For the long trade, a 3x risk calculation gives us a profit target of $9,355.50. Once Bitcoin prices reach this level, traders should consider closing the position for a profit.
SUMMARY
- Price gaps are empty spaces on an asset’s chart history that emerge when a surge in buying or selling activity leads to significant short-term changes in the market’s underlying valuation.
- Traders looking to capitalize on price gaps will have several methods for spotting the type of gap in place (and the ultimate trend projections that are likely to follow).
- Price gaps tend to occur during periods of rising market volatility, so traders employing these strategies often utilize reduced trading sizes in order to protect against potential losses.
- Gap trading scenarios often result from changes in market volume that indicate limited trading liquidity. These environments often produce erratic price moves that increase risk for traders, which creates a need for protective stop losses on all positions.
- Gaps will often occur unexpectedly and lead to unanticipated losses for traders that are already in a position that opposes the market’s new direction.
- In most cases, price gaps are classified as Common, Continuation, Breakaway, or Exhaustion Gaps (based on where the gap occurs in the chart’s price structure and what the gap ultimately signals in market sentiment).
- Strategies that implement risk-reward ratios structured with a 3:1 favorability help produce long-term profitability that doesn’t necessarily require success in a majority of gap trading positions.


