
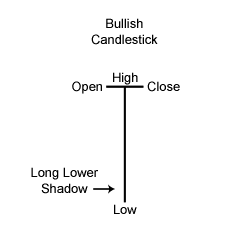
Dragonfly Doji are a candlestick patterns that signal rising possibilities for a bullish reversal in the market price of an asset. After an extended decline, Dragonfly Doji candlesticks develop when the opening price, the closing price, and the price high for an asset are nearly equal in value during a specific trading period. The price low for the same period must also include a long lower shadow, which indicates instances of downside market volatility that is quickly followed by a sharp return back to the asset’s opening valuation for the period. In the following diagram, we can see how a Dragonfly Doji candlestick can be constructed:
Perhaps what’s most important about the candlestick structure is the fact that its extended lower shadow indicates aggressive selling pressure during the charting time frame of the candle period. However, since market prices closed within relatively close proximity to the opening valuation, the development of a Dragonfly Doji pattern suggests that buyers had enough control of the market to absorb this surge of initial selling pressure and maintain a foothold without experiencing sustained declines.
In this way, Dragonfly Doji candlesticks that follow market downtrends can offer powerful trading signals that may suggest rising potential for future gains in price, and traders can capitalize on the development of these candlestick formations by establishing new long positions in the asset that generated the pattern. Since expert market traders are always looking to “buy low and sell high,” technical analysis strategies that use confirmed Dragonfly Doji patterns are often able to profit when new long positions are established during the early phases of an emerging uptrend.
Chart Example: The Dragonfly Doji Pattern
Dragonfly Doji patterns are somewhat rare in the market but they signal increasing potential that price trends are about to see a significant turnaround. Following a longer-term downtrend, the majority of the market’s momentum is strongly focused on the downside. Once this price momentum reaches a point of exhaustion, its final point of completion is usually expressed as a “flash” event to the downside. With no more sellers left in the market, buyers are able to enter at the beginning of the next uptrend. Ultimately, a strong price performance on the day that follows the Dragonfly pattern helps to confirm the reversal.
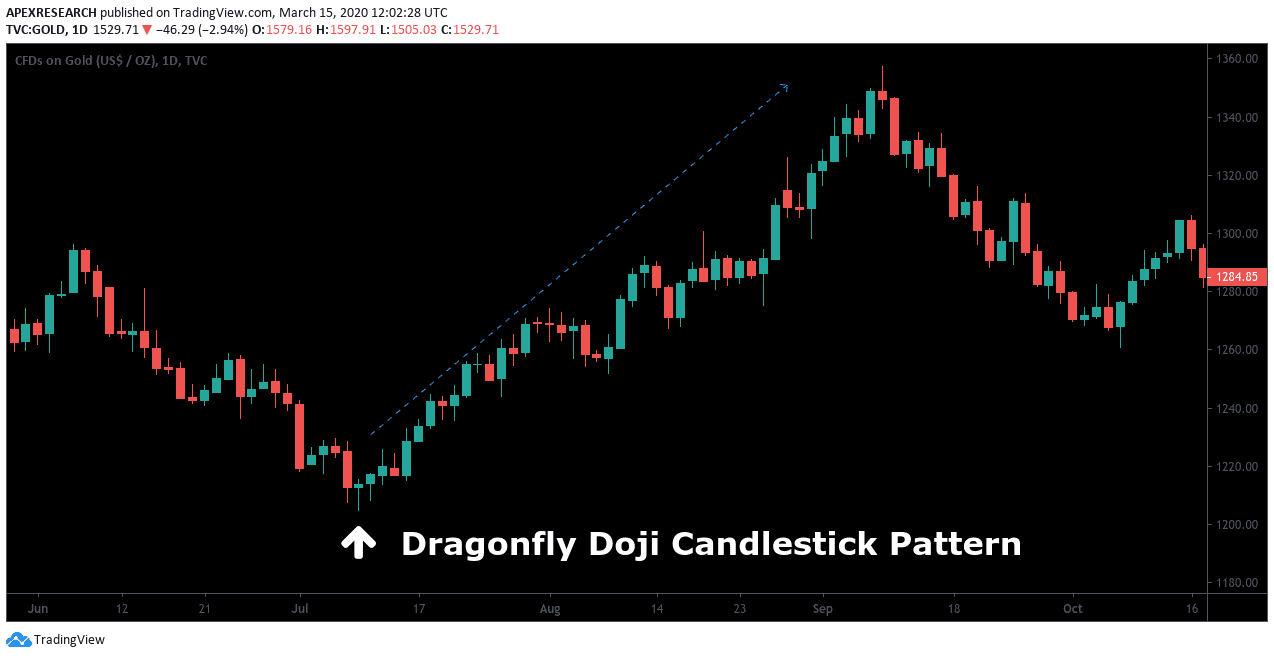
In the chart example above, a bullish Dragonfly Doji follows a medium-term downtrend. Long positions can be taken after a successive bullish closing period works as a confirmation for the trigger signal. In many cases, expert traders will enter positions shortly after the close of the following price candle. This helps to prevent false breakout signals that can quickly result in unnecessary losses. When entering into long positions on a bullish Dragonfly Doji reversal, stop-loss orders are placed under the price low of the pattern.
Ask Traders Summary: Dragonfly Doji Candlestick Patterns
- Dragonfly Doji patterns may occur after a significant downtrend or price decline.
- Opening prices, closing prices, and price highs must occur near values that are very close to each other.
- Visually, we can see that the price low of the period is far below the other three price periods and this produces a T-shaped chart structure.
- Dragonfly Doji patterns that occur after price decline indicate prices may increase in future trading sessions and the price pattern is confirmed if the next candlestick rises the prior session highs.
PEOPLE WHO READ THIS ALSO VIEWED:


