Pivot Points allow traders to define important support and resistance levels or to identify potential changes in trend direction. However, there are five different types of pivot points that are commonly used by technical analysts, so it’s important to understand where and how they can be used to provide you an edge when assessing the markets.
YOUR CAPITAL IS AT RISK

Each type of pivot point trading indicator provides a slightly different take on the discipline’s established concepts.
Table of contents
Pivot Point Types
Here’s a quick overview of the five we will discuss in more depth:
Standard Pivot Points are also referred to as Classical Pivot Points or Floor Pivots, and these two trading terms are often used in interchangeable ways. Quite literally, these are the “standard” pivot points that are plotted in the default settings of most modern trading stations.
Woodies Pivot Points employ calculations that are quite different relative to standard formulas for pivot points. Woodie’s pivot points use a formula that places additional weight on the market’s closing prices.
Camarilla Pivot Points are often similar to the Woodies pivot points because both systems use closing prices from the prior day in order to compute key support/resistance levels. The Camarilla Pivot Point system’s main difference is that its techniques are based on a system that uses a total of nine price levels.
The Fibonacci Pivot Points strategy technique involves the use of Fibonacci studies (projections, extensions, and retracements)to determine trend direction and trading stance.
Demark Pivot Points are different from most others because they are conditional in nature with an outcome that is based upon relationships between closing prices and opening prices.
While this list of different pivot point techniques might look intimidating at first, it should be understood that the basic ideas and concepts that underlie the market’s broader approach to pivot point trading strategy remain largely the same.
What Are Pivot Points?
Pivot points are a popular technical analysis tool used by traders to identify potential levels of support and resistance in a market. They are used to predict the future price of an asset based on the high, low, and closing prices of a previous trading session.
Generally speaking, pivot lines are plotted horizontally in order to indicate potential zones of support or resistance. Any time a chart breakout occurs near these pivot zones, the direction of the break (upward or downward) can work as a primary indicator of market sentiment so that new trading positions can be established based on the trend as it emerges.
Standard Pivot Points
Standard Pivot Points allow traders to plot support and resistance levels around a central pivot that is determined by a series of simple calculations. The central price pivot takes the sum of the price high, the price low, and the closing price of whichever time period is selected in a trader’s charting station. This total sum is then divided by a factor of three, and this figure forms the basis of future pivot point indicator readings.
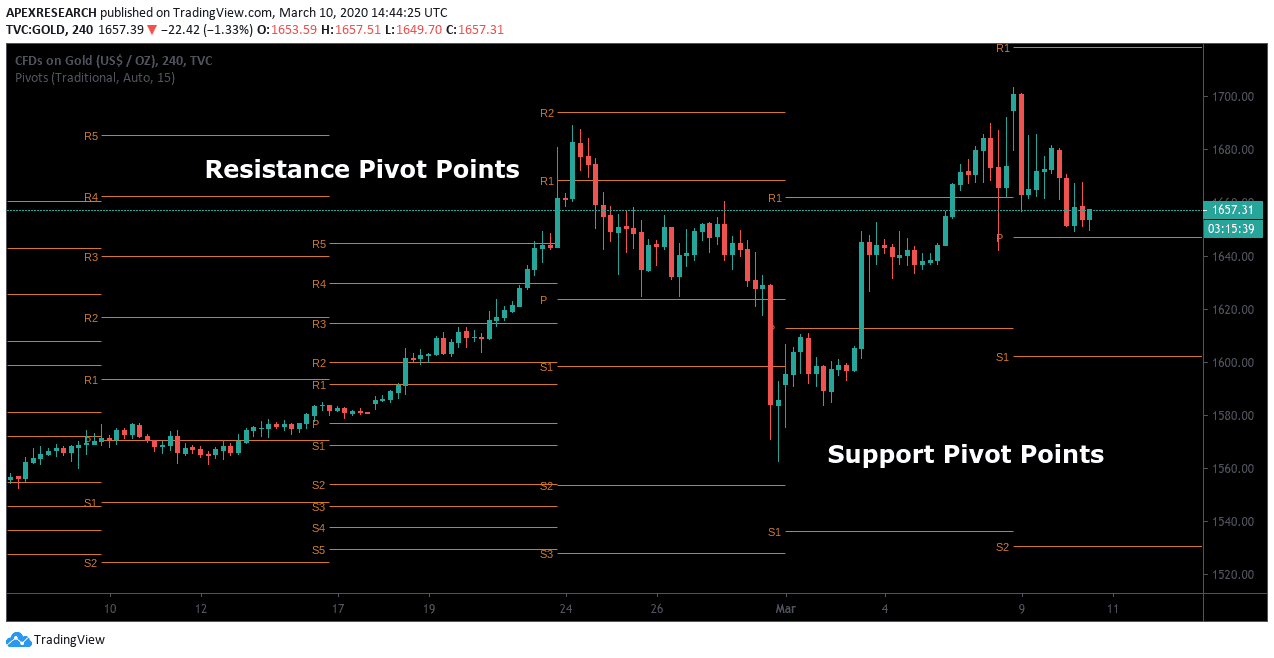
In the chart example shown above, we can see pivot points that have higher prices are expected to act as resistance levels. In contrast, pivot points that are below prices are expected to act as support levels.
Camarilla Pivot Points
Camarilla Pivot Point indicator systems were first introduced to the financial markets in the 1980s by Nicolas Scott. These trading systems were based on concepts that are similar to Woodies because pivot prices are based on prior-day closing prices. For traders, the main difference between Woodies Pivot Points and Camarilla Pivot Point trading rules usually lies in the fact that Camarilla trading strategy systems are based on four levels of price resistance and four levels of price support. Remember, this is in contrast to the Standard Pivot Point system, which is based on just two price levels for resistance and two for pivot support.
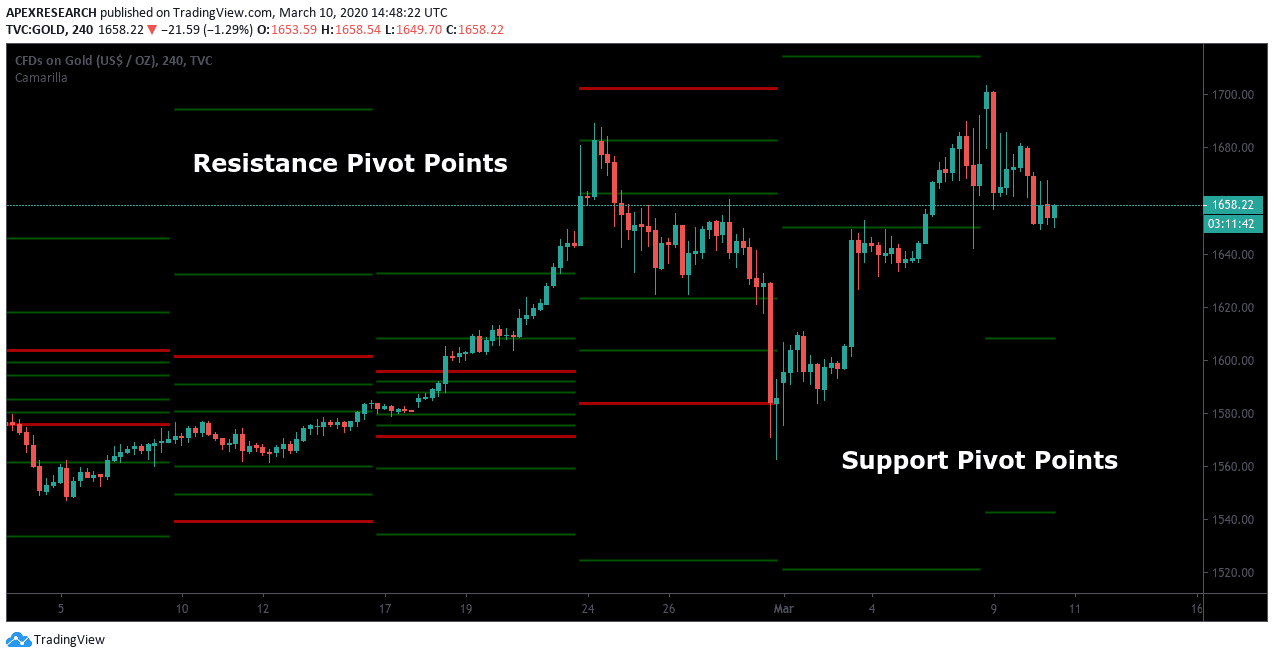
Another interesting point for traders to remember is that the equations for the Camarilla system use formula variables that are much more specific and systematic in nature. In the Camarilla pivot points formula, non-zero decimals (i.e., 1.5, 1.25, 1.16, and 1.0833) are used as the multipliers, and each of these equations creates nine different price levels on the trading station.
For newer traders, the Camarilla daily pivot trading strategy system might be more challenging, given the fact that each price chart will show four different support levels and four different resistance levels. However, this additional information can also prove to be highly useful for experienced traders who are somewhat familiar with using pivot points for day trading strategies.
Many traders utilize Camarilla pivots indicator mt4 through intraday strategies that fade short-term trend moves after prices have reached S3 or R3 levels on the trading station. In these cases, short trades might be established after prices rise to R3 price resistance (with the goal of selling high to maximize profits). Conversely, long trades might be established after prices fall to S3 price support (with the goal of buying low). The main idea is that cyclical markets offer opportunities during rising and falling trend activity and this makes it much easier to achieve profits in diverse financial environments.
Pivot strategies typically work based on the assumption that strong trends in price activity during one session will often be followed by trading sessions characterized by retracements during the next market session. Historical backtesting results suggest market trading ranges typically accompany this type of price action, so day trading pivot points can often make it easier to structure trades in live broker platforms. Additionally, pivot points can help traders find levels to place stop-loss orders and these protective techniques are often placed outside of S4 support or R4 resistance zones.
In cases where market price activity continues to move beyond S4 or R4 pivot zones, traders might instead opt to implement a “stop and reverse” strategy. In other words, prior long positions can be closed so that new short positions can be established. Similarly, prior short positions can be closed in cases where new long positions should be established for the same financial market asset.
Fibonacci Pivot Points
Fibonacci numbers are regularly used in modern portfolio strategies for investments, and this type of analysis can be applied to those individuals who are using pivot points for day trading, as well. On trading station software applications, traders can easily find tools allowing access to popular trading platforms like the Fibonacci pivot indicator in MT4. Fortunately, these trading programs make it easier for investors to find economic indicator studies related to Fibonacci retracements, projections, and extensions. Interestingly, these tools are often employed by people who trade using pivot points in the Forex market or in cryptocurrencies. However, these tools can also be quite effective in commodities markets and stock markets, as well.
Primary price levels in Fibonacci pivot formulas are typically associated with the Fibonacci numbers at the 38.2% and 61.8% retracement levels. These trading tendencies often force investors to monitor these retracement levels quite closely whenever trades have a chance to reach profitability based on the system projections. One strategy that is actively used in the market is to view important Fibonacci pivot point indicator readings in combination with price patterns (such as a triangle pattern or head and shoulders pattern). Additional price patterns that work in conjunction with pivot point price levels are often viewed as strong market signals.
Woodies Pivot Points
Less commonly used pivot point indicators include the Woodies Pivot Points indicator. Woodies Pivot Points also allow traders to plot two pivot support and resistance levels based on a central pivot. Under the system, this central pivot places the first resistance level at a price point that’s 2x the Pivot Point minus the price lows. Finally, the price boundary that results is plotted using the sum of the Pivot Point and the difference between the price high and price low of the charting period.
The pivot calculation that is used for the Woodies pivots systems is often described as being quite different from the formula that determines levels for Standard Pivot Points. In this respect, a primary difference lies in the fact that the formula for the Woodies system places additional weight on an asset’s closing price activity. As a result, this system works in ways that are similar to strategies that involve the use of Exponential Moving Averages (EMAs) because price data that is recent will be weighted most heavily (in relation to earlier price data).
Demark Pivot Points
Demark Pivot Points were designed by a well-respected technical analyst and trader, Tom DeMark, who has been famous for his innovative technical analyst trading techniques for decades. Demark’s Pivot Points help traders identify potential support and resistance levels by using past price data.
However, unlike standard pivot points, Demark Pivot Points incorporate the closing price in relation to the open price in its formula.
The Pivot Point is calculated from the previous day’s high, low, close, and opening price, while additional resistance levels (R1, R2, R3) and support levels (S1, S2, S3) are calculated using multipliers.


