
What Is The Triangle Chart Pattern?
As mentioned, there are three main types of triangle pattern…
These are the symmetrical triangle, the ascending triangle and the descending triangle, with each having different implications for market movements…
While they are generally considered continuation patterns, there are instances when they can signal a reversal in the current price direction.
So, if you take a look at the pictures below, you will notice that triangle patters will have at least two highs and two lows that, when connected with a trendline, will form a triangle.
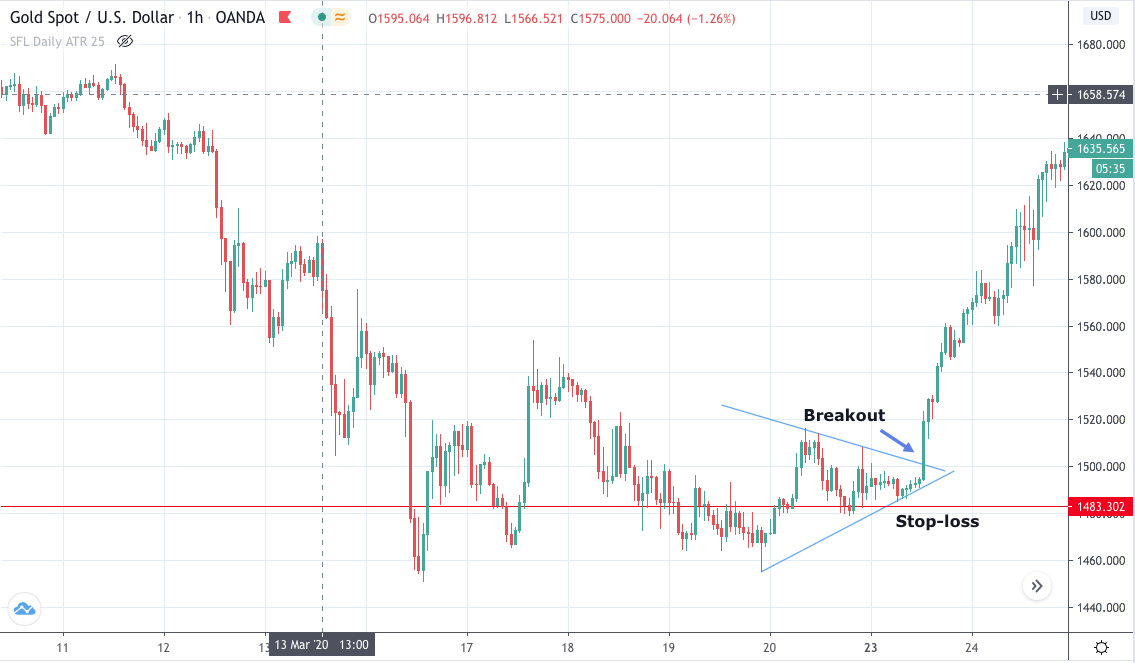
So firstly, let’s look at a symmetrical triangle…
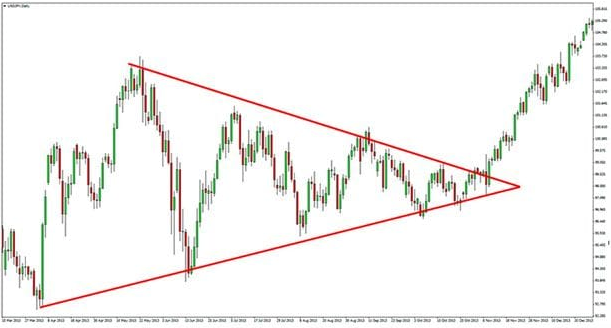
As you can see, in a symmetrical triangle the price range continues to narrow until it gets to the end of the triangle and we see a breakout. The majority of traders will wait for at least three swings in price before confirming the pattern.
One thing you will notice with the pattern is that there is usually a strong breakout.
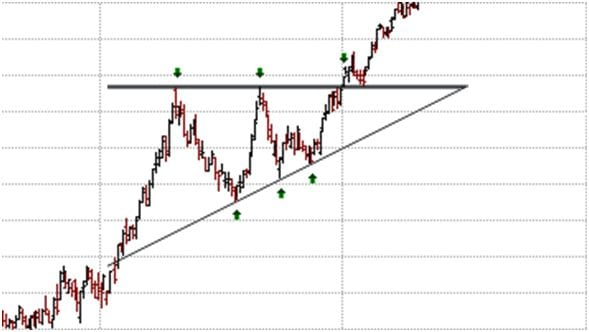
Now, when it comes to the ascending triangle, you will notice there is a strong resistance level that price will struggle to break through a couple of times.
However, with each bounce the subsequent move lower becomes increasingly shallow, resulting in higher lows which form the bullish trend line of our ascending triangle.
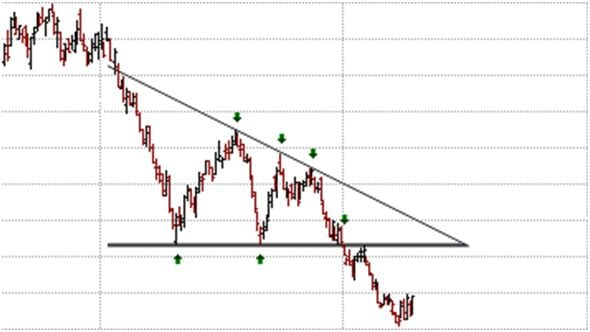
The descending triangle is the opposite…
There is a strong support level, and with each bounce off of that support level, we see lower highs that indicate a bearish trend.
If you use a volume-based indicator, you will usually see a decline in the trading volume as the triangle forms.
Trading Using Triangle Patterns
If you’re trading a breakout strategy, then the triangle pattern will be one you want to take notice of.
You will be able to implement all three triangles into the system, giving you the ability to trade bullish, bearish and consolidating markets.
When using the strategy, a buy signal occurs when the price moves above the resistance trendline in the ascending triangle, and a sell signal occurs when it declines below the support trendline in the descending triangle.
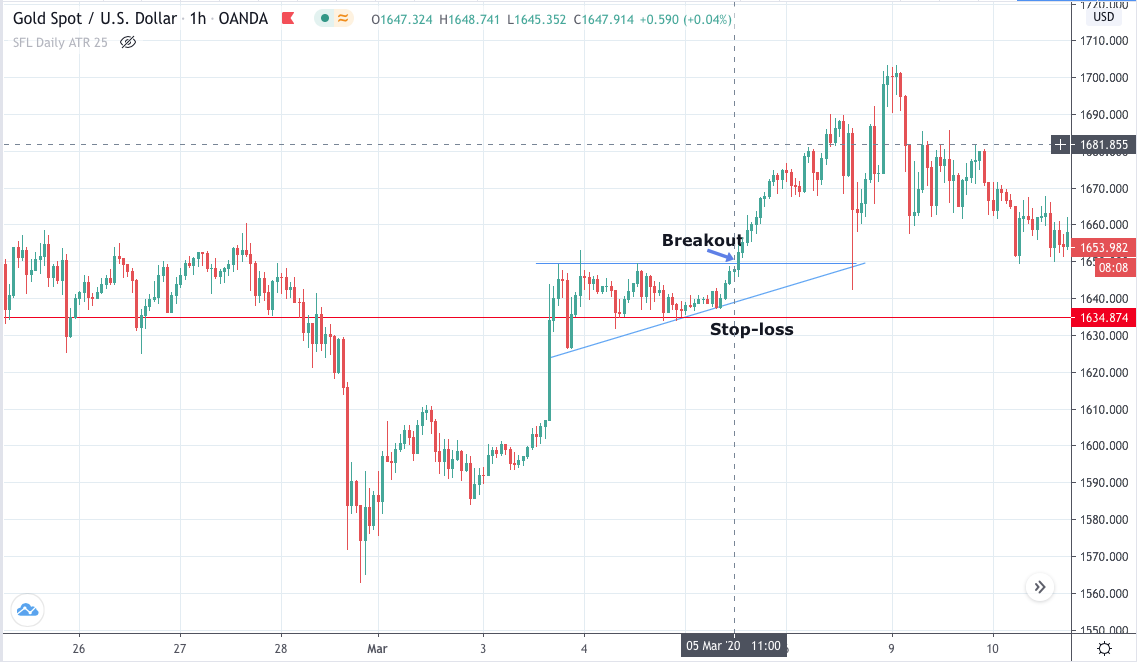
You can set your stop loss above or below the most recent swing depending on whether it is a bullish or bearish move.
With symmetrical triangles, they are usually considered continuation patterns. However, in my personal training experience, I have noticed that they could break out in any direction and so, it may be a good idea to use that pattern in conjunction with another piece of analysis to determine your directional bias.
Advantages
A definite advantage when using this pattern is when it works correctly, you will typically see a sharp break…
This is because the buying or selling volume has been building for some time, and the bears/bulls defending the support/resistance level will usually be taken out of their positions. Stops will usually be placed just beyond the levels, and once they get taken out, it adds a higher amount of selling or buying volume to the trade.
Disadvantages
As we have explained before, with a lot of technical indicators or strategies, there will be at least one downside, which is why it is essential to filter out positions using other analysis tools.
The downside with the triangle pattern is false breakouts…
Now, I know I have mentioned this on a lot of other strategies, but it occurs with the triangle pattern as well.
However, I must say, I have used this strategy before, and while there are false breaks, they are definitely more limited than other trading strategies we outlined on the site.
Useful Pages:
Compare Stock Brokers | Compare Forex Brokers | Compare CFD Brokers
Conclusion
As you can probably tell, we really do like this strategy and chart pattern.
While no strategy is full proof, we really feel that this is one that can be used alone to a high degree of success, without the need for other indicators.
However, as always, it is vital that if this is a strategy you want to use, you backtest it vigorously on the asset you are trading, as in some cases, specific strategies just work better on certain assets.
PEOPLE WHO READ THIS ALSO VIEWED: