Trendline trading strategies are one of the most simple and powerful trading signals in the market.
Using a graphical representation of price, and indeed other metrics including trading volumes, can help traders spot major signal posts in the market. Trendline indicators are so commonly known and used that the market can literally turn as and when a trendline breaks.
Using them allows traders and investors to consider market direction over a multitude of timeframes and take an opinion on how long price momentum might hold up. In this article, we’ll use real-life trade examples to look through trendline trading strategies, exploring:
Trendline Strategies Explained
The starting point for trendline strategies is a chart showing price data over a period of time. The price action will rarely be in a straight line, but there could be moments when price appears to rise or fall to keep in line with the general direction of travel. These price trends can be studied using the freely available charting tools found at all good brokers.
Trendlines that have a specific and identifiable trajectory can be drawn by connecting high or low price points that appear over time. These lines then form levels of support or resistance and identify the price levels where the forces of supply and demand compete to determine whether a trend is going to continue or fail.
Trendline Strategies – China A50 Index with Supporting Trendline
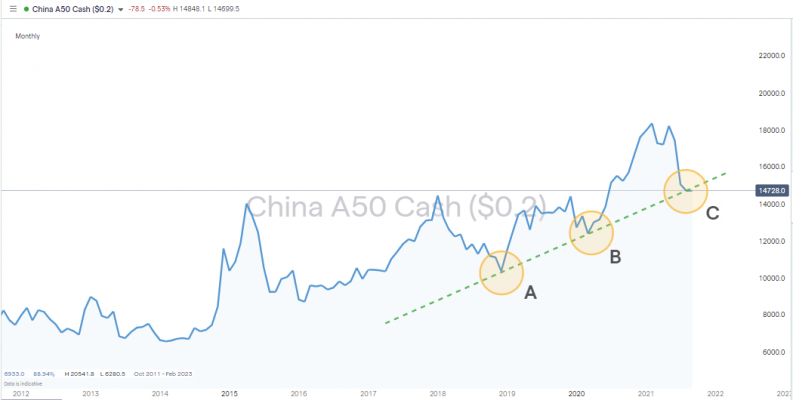
Source: IG
The above chart of the China A50 stock index covers the period 2012 to 2021. The trendline represented by points A, B and C represents support for the index when price reaches a certain point.
Using Trendlines in Bullish and Bearish Markets
Trendlines don’t all point upwards. The below example of gold shows bearish price action during the time period August to September 2021.
Trendline Strategies – Silver Market with Featuring Trendline Resistance
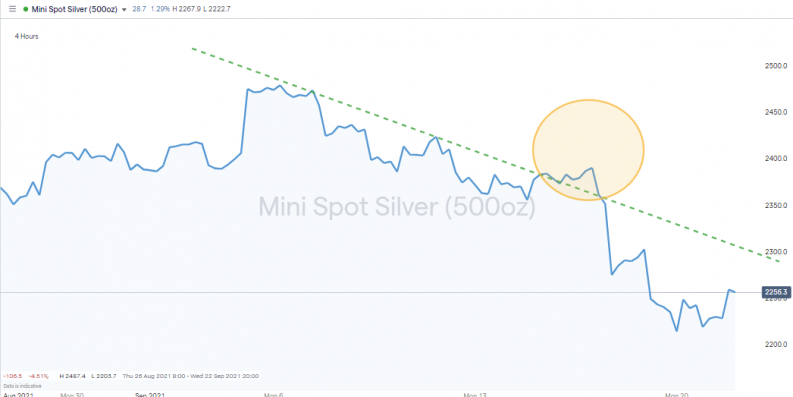
Source: IG
Also note how price breaks the downward trendline during the time period marked in yellow. While the break is undeniable, one interesting feature of trendlines is that they can continue to be useful. When price breaks back through the trendline to the downside, the trendline continues to be an effective visual guide. Supporting trendlines that are broken can then become points of resistance, and vice versa.
- The more times that price touches a trendline, the stronger the signal.
- Trendlines don’t become redundant when price breaks through them.
- Trendlines can switch from being supporting to resisting price moves.
- Trendlines can be applied to various market metrics, not just price.
Trendline Strategies – Nasdaq 100 Index with Supporting Trendline
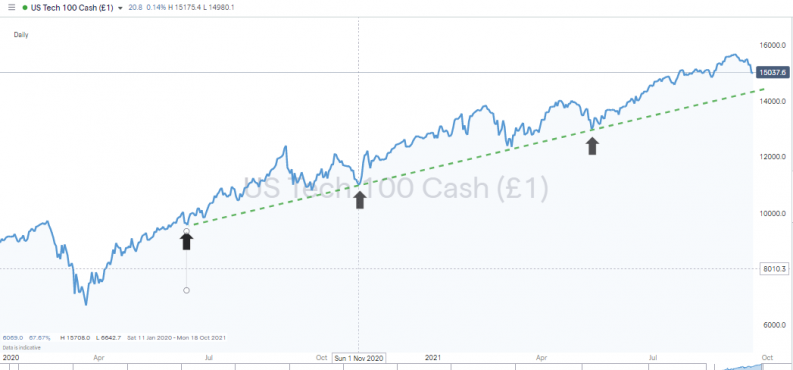
Source: IG
Price action can be guided by support and resistance trendlines at the same time. The below bearish move in forex pair GBPUSD illustrated price being channelled downwards in a descending wedge pattern formed by the fact that the two lines are converging.
Trendline Strategies – GBPUSD with Resistance & Supporting Trendlines – Descending Wedge Pattern
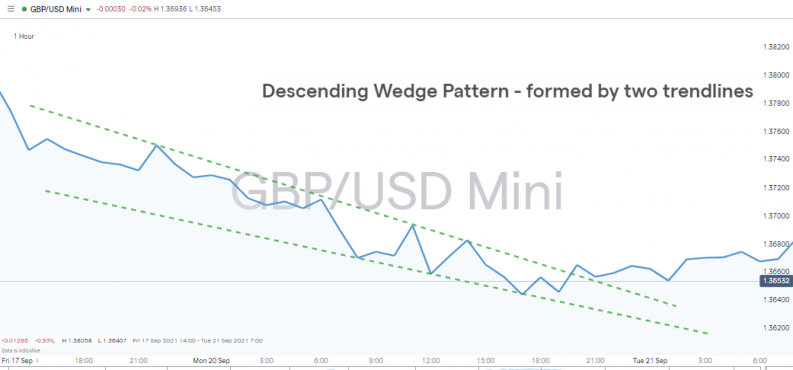
Source: IG
YOUR CAPITAL IS AT RISK
Basic Trendline Strategies
Part of the simplicity of trendline strategies is that when price action moves towards a trendline, there are two possible outcomes:
- Trendline bounce– This is where price touches and bounces off the trendline and confirms that momentum is still moving in the same direction. Each time a trendline experiences a bounce, the stronger it becomes as a trading signal.
- Trendline break– A trendline break signals a potential change in trend. It might be a change of gradient, that a trend is weakening or strengthening, or it might mark a complete reversal. In the below price chart for Bitcoin, when trendline T1 is broken, price trades in a roughly sideways pattern, but after breaking T2 reverses in direction. T2 has an earlier starting date, and it could be argued that this makes it more significant that it is broken, which is why the sell-off was stronger in nature.
Trendline Strategies – Bitcoin with Two Supporting Trendlines
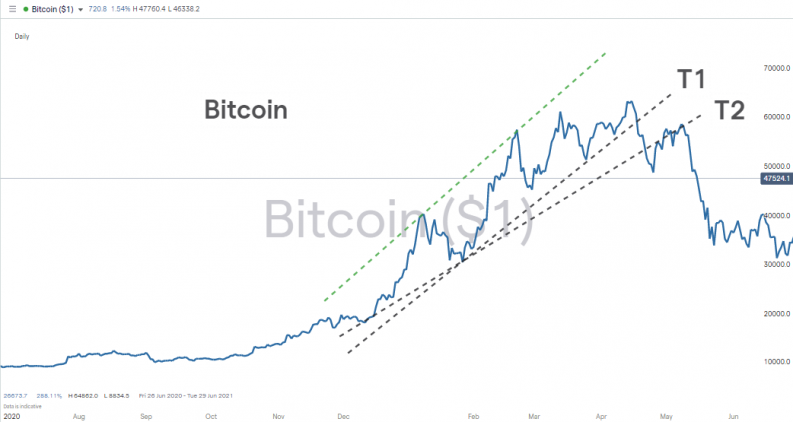
Source: IG
The binary nature of the possible outcomes makes trendlines relatively easy to trade. In their simplest form, price does or doesn’t bounce/break.
Strategies that use trendline bounces take the signal as there is no need to exit a winning strategy.
Strategies that focus on trendline breaks are based on the idea that the breakout could be the start of a new trend, and getting into trends early is always a good idea. Breaks therefore benefit from two different market moves. The first group is those who are in positions bailing out of them – those traders who were hoping for a bounce but are disappointed. The second group is made up of those who are not in a position deciding to act and get into one. At the time of a trendline break, both of these groups of traders will be trading in the same direction, which is why trendline breaks can be associated with strong subsequent price moves.
YOUR CAPITAL IS AT RISK
Trendline Strategy – Trade Entry Rules & Stop Losses
There is also the potential to use the trendline to set a tight stop loss, meaning that if a trendline break strategy doesn’t work out, then at least losses will be minimised. In the above example of the Bitcoin market, once price breaks through T2, a stop loss set above that price level would not have been triggered. After the break to the downside, the line T2 then successfully acts as resistance.
The same principle can be applied on a trendline bounce strategy. Using the trendline bounce as a buy signal instils some discipline into the decision-making process. The patient approach means that price entry point is optimised, and a stop loss can be applied that is just below the trendline. This trade entry point uses a strong trading signal to enter a position with a good risk-reward profile. In the example, the stop loss is set at 2% below the value of the index at entry, but the subsequent price rally represents a +15% gain and one that is still continuing and trading above the supporting trendline.
Trendline Strategies – Nasdaq 100 Index with Supporting Trendline – Trade Entry & Stop Loss
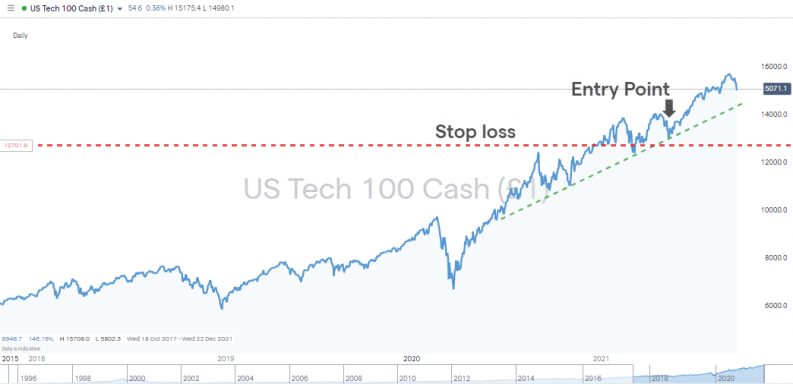
Source: IG
Below are some standard techniques used for trading trendline strategies that are worth practicing using in a demo account.
Stop Losses and Take Profits in Upward-Trending Markets:
- Set your protective stop loss below the trendline at the entry point. Trailing stop losses that follow price upwards but remain below the trendline can be applied.
- Take profit after a price breakout below the trendline.
Stop Losses and Take Profits in Downward-Trending Markets:
- Set your protective stop loss above the trendline at the entry point. Trailing stop losses that follow price downwards but remain above the trendline can be applied.
- Take profit after a price breakout above the trendline.
Advantages of Using Trendline Trading Strategies
- One of the oldest and most tried technical indicators. Trendline strategies have been used successfully for centuries.
- The simplicity of the approach means that trendline strategy analysis is built on robust principles – something is trading above or below a trendline – there are very few grey areas.
- Works well in both trending and range-bound markets.
- Can be applied across all asset groups.
- The popularity of the strategy means that good brokers supply the software tools as standard. It’s just a case of selecting the features that help you most.
- With so many traders using the strategy, there is a strong chance of trading with the market rather than against it.
- Riding trends is a great way to maximise your profits, and trendline analysis can help you do that.
- Analysis methodology such as trendline analysis can help investors develop their trading discipline.
- Fits in well with other strategies.
- It’s possible to set up trades with relatively generous risk-return ratios. Setting stop losses just the other side of a trendline minimises risk to the downside, and if the trend goes your way, then profits can be considerable.
- Although trendlines are lagging indicators, they use historical data. The extrapolation of the trendline into the future means that they offer an indication of where price is heading, not just where it has already been.
Disadvantages of Using Trendline Trading Strategies
- There is some debate about what constitutes a trendline, or more precisely which one to use.
Purists are of the opinion that three touches are required before a line is confirmed, but there are many ways of approaching the topic.
- Market moves that involve three touches of a trendline can soon break down. Momentum indicators such as Ell work on this basis – which means that the point at which a trendline appears most robust can be where it actually breaks down, meaning that the third touch is a false signal.
- Building trendlines using fewer touches – for example, two – can result in there being several trendlines to choose from. The trick is establishing which one most of the rest of the market is likely to be using.
- Technical indicators in general are limited by the fact that they are lagging indicators based on previous price activity. Trendline strategies are not immune from this criticism as they are based entirely on historical data.
- There is a range of common problems that explain why technical indicators fail.
- Paradigm shift – trading solely using technical indicators introduces the risk of price changing due to fundamental Charting is a useful tool, but it is also important to keep up to date with market news events.
- All periods of market momentum eventually come to an end. Like other technical indicators, trendlines can’t escape this simple market fact. This means that risk management is essential to ensure that aggregate returns are positive.
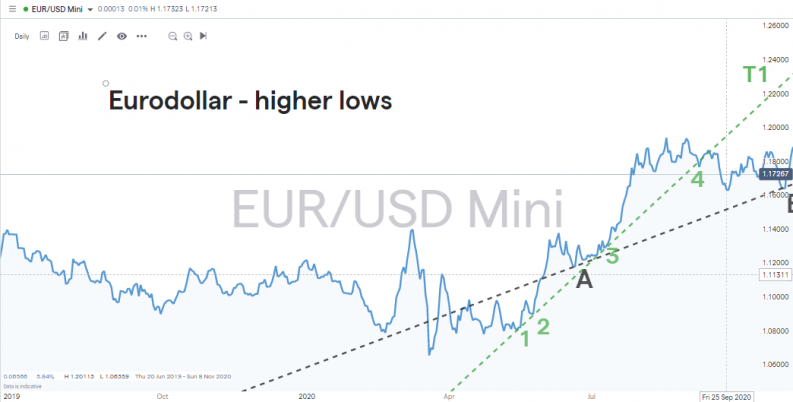
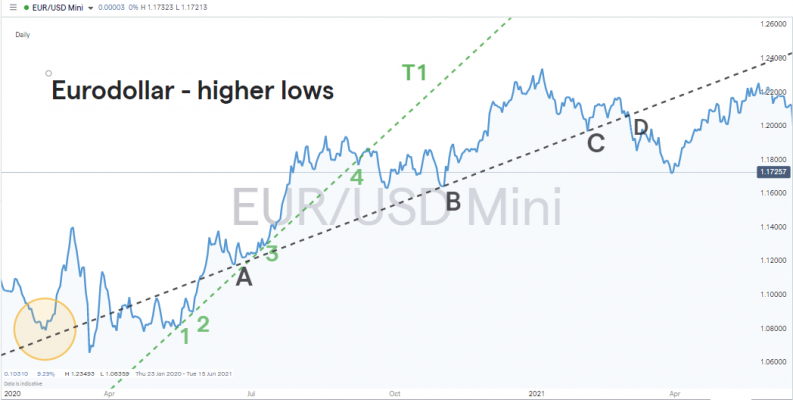
Case Study – Using Trendlines to Trade Trends in Forex – EURUSD
- In the below case study, an upward trend in the EURUSD forex pair is marked by trendline T1 and trendline bounce points 1, 2, 3 and 4. Bounce point 4 actually marks the breakdown of this steeper trendline and highlights how trendlines with more confirmed bounces are traditionally regarded as being more reliable but can also act as a contrarian indicator.
- Anyone who decides to sell short at point 4 could successfully enter into a short position and make a profit, but there is no major reversal in trend patterns. Instead, there is a period of sideways trading and several moments when there would have been potential for price to trigger a stop loss set too closely to the breakout short trade entry level near to point 4.
Source: IG
- Zooming out of the price patterns, it’s possible to see how a second upward trend is still in place. Even if not quite as strong as the initial one, the trendline that uses points A, B and C can also be traced back to the yellow circle and a significant low price point in the region of 1.08. Given the way that price held at that level, 1.08 appears to be a strong support level.
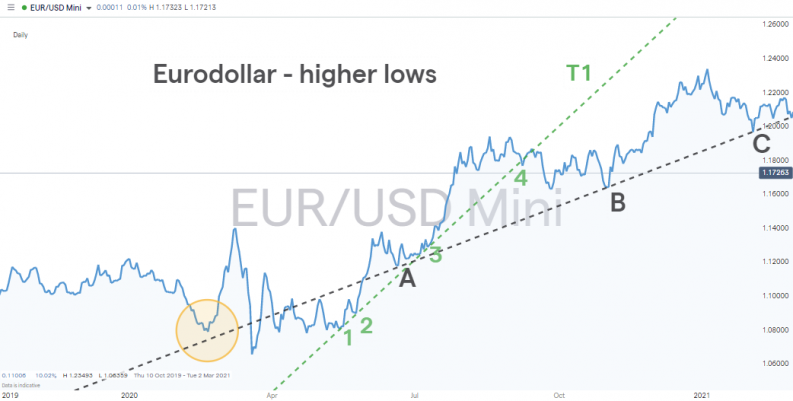
Source: IG
- The bounce off the trendline at point C is followed by further upward price movement, and stop losses that were set just below the trendline at C would have not been triggered. This is a classic use of trendlines to identify a trend and provide a relatively low risk entry point.
Source: IG
- The break of the supporting trendline at point D is again followed by a period of sideways trading. There is an opportunity to make a profit by trading the break, but the reversal is relatively short-lived and stop losses set above the trendline at point D, in the region of 1.21, would ultimately be triggered.
Additional notes:
- In this example, there would have been more reward from trading trendline bounces early rather than waiting for additional confirmation or looking to trade a trendline breakout strategy.
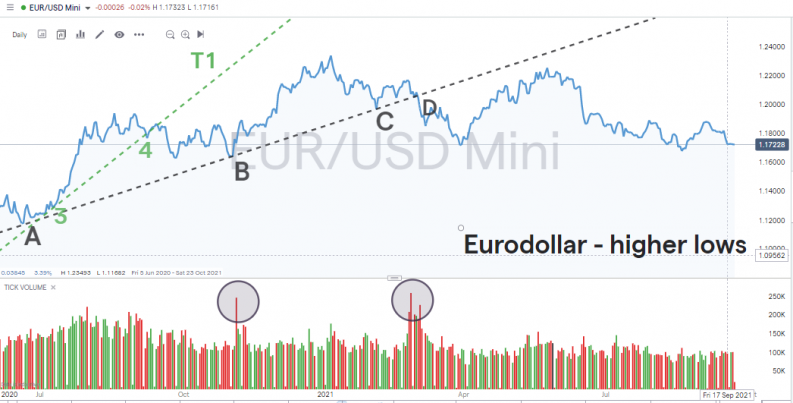
- The trading volume data highlights how bounce B and breakout D were associated with times of increased market activity. This goes some way to supporting the idea that the trendline using B is a strong indicator – and trading the bounce at C would have, at least initially, been a profitable trade. It also points to the breakout at D being a well-supported move. This one may not have been as profitable as the move was towards sideways trading rather than a complete reversal, but it was a notable move away from the previous upward trend.
Source: IG
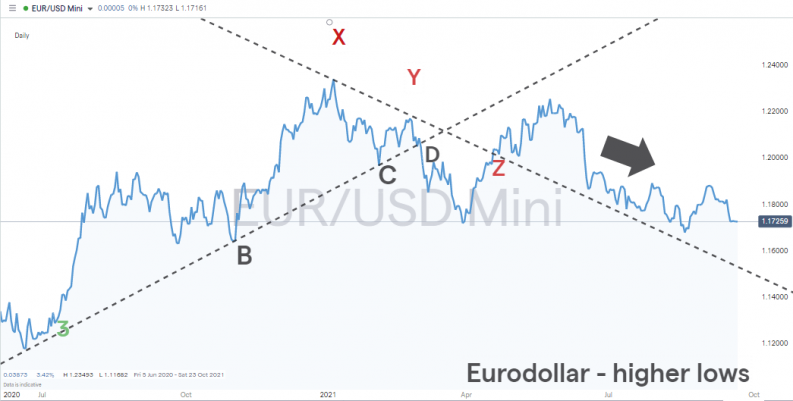
- The lower highs X and Y, which mark the fizzling out of the upward trend, in turn create a trendline in the downward direction. At first, it acts as a resistance level, but after the break at Z, it still guides the downward move of the market but now as a supporting trendline. The black arrow showing price tracks the trendline quite closely. This kind of switch from support to resistance, or vice versa, is something to look out for.
Source: IG
YOUR CAPITAL IS AT RISK
What Next For the EURUSD Case Study?
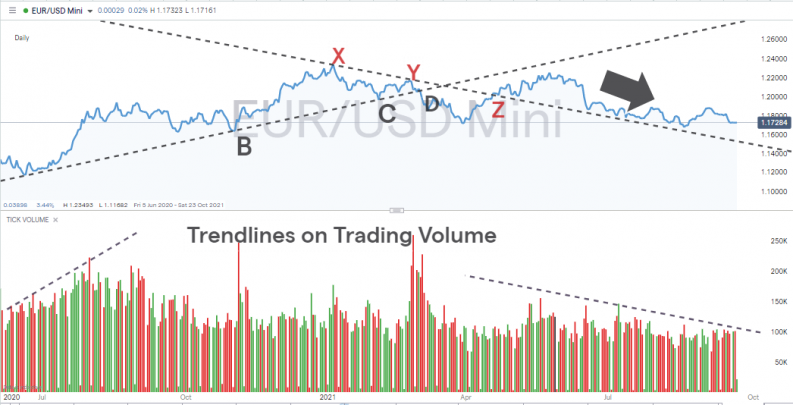
The answer to this question involves using trendlines on metrics other than price. The below chart incorporates volume as well as price data. The start of the price moves from A, to B, to C is marked by an uptick in trading volume. This is a sign that the move is well supported. Buyers and sellers are coming into the market in large numbers, as demonstrated by high volumes, and it is buyers who are prevailing, as demonstrated by price.
Source: IG
After points Y and Z, trading volumes drop off, as demonstrated by the trendline on the right-hand side of the chart. There’s no reason why EURUSD can’t come back to life, but at the moment, the lack of activity is also being matched by sideways price action. Those looking to spot and trade the next trend may need to be patient if studying EURUSD in the near future.
Other Strategies That Work Well With Trendline Indicators
Trendline strategies are great for providing a clearer and intuitive understanding of market momentum. They offer tight stop losses and clear trade entry and exit points, but all indicators benefit from being used in conjunction with others. Whether your trading style is based on day trading, swing trading or trend following, incorporating signals from the below is always a good idea. What is additionally useful is that all of the below can work on different time-lines, from intra-day to monthly, which is similar to the way that trendlines can work.
The Bottom Line
Trendline candles make charts more readable and trends easier to analyse. Developing trend-spotting skills is a key ingredient to successful trading, and using trendlines helps traders to go with the flow rather than against it. It can’t be guaranteed that future price moves will carry on in the same direction, but the trendline approach tilts the scales in the right direction.
It’s possible to use trendlines to place trades with precise entry and exit points and the charting tools used are freely available at good broking platforms. Whether you’re using a demo or live account, incorporating trendlines into your analysis is an ideal way to start picking up on the mood and direction of the market.
Further Reading
- Read here to learn about the nature of market momentum and Elliott Wave Theory.
- Dip-buying and trading trendline bounces are both related to these strategies, which trade using swing lows.
- If you need to fill in some gaps in your analysis, head here to find out about other indicators used to spot trends.
- When trendlines converge, they form pennant patterns, which have their own range of indicators and trading techniques.
- Take your trendline analysis to the next level using specialist TD trendline methodologies.


