
This article is a step by step guide on how to trade TD line breakouts and use risk management to generate a profitable trading strategy. DeMark believes that supply and demand dictate price action. When demand exceeds supply, prices will advance and conversely when supply exceeds demand prices will fall.
The difficulty in determining a pivot point in sentiment was accomplished by DeMark in creating an objective way to measure breakouts and breakdowns. DeMark created objective trend lines which can be used to create breakouts which will help determine if demand or supply is advancing. The proper construction of trend lines is the basis for TD trend lines.
What are Trend Lines?
A trendline is a line with a specific trajectory. It is drawn to connect a group of highs or lows, and the slope of that line determines the next level of support or resistance. The trend line shows the speed of price and creates a visual representation of supply and demand.
Supply and Demand
There is always a buyer and seller at every price. When the volume of buyers and sellers increase at a certain level, the price has reached equilibrium. If this equilibrium occurs near a trend line, traders will often call that level support or resistance.
How are TD Lines Created?
Thomas DeMark wrestled with the idea of how to create an objective trend line based on supply and demand. He concluded that you could find strong support when you found a low point that was surrounded by multiple higher lows in the period preceding and succeeding the TD demand point.

DeMark determined that the strength of the DeMark pivot point could be objectively determined. A TD pivot point that was a low that was surrounded by two higher lows in each side was even stronger than one higher low on each side. A low that was surrounded by 3-higher lows on each side was even stronger and was the strongest TD pivot point he would use in creating the TD pivot points.
Generating a TD trend Line
To create a TD trend line break down, you want to connect the most recent TD pivot low that is surrounded by 1,2,or 3 higher lows to the next TD pivot low that is surrounded by 1,2, or 3 higher lows. DeMark states that you want to use the same number of preceding or succeeding lows when generating a TD trend line. For example, if you determine that you are going to use a TD pivot with 2-higher lows, both TD pivot lows should have 2-surrounding higher lows. Additionally, the first of the TD pivot lows that you use should be lower than the succeeding TD pivot low which should generate an upward sloping trend line. TD trend line that leads to a TD break down are always upward sloping or horizontal but are never downward sloping.
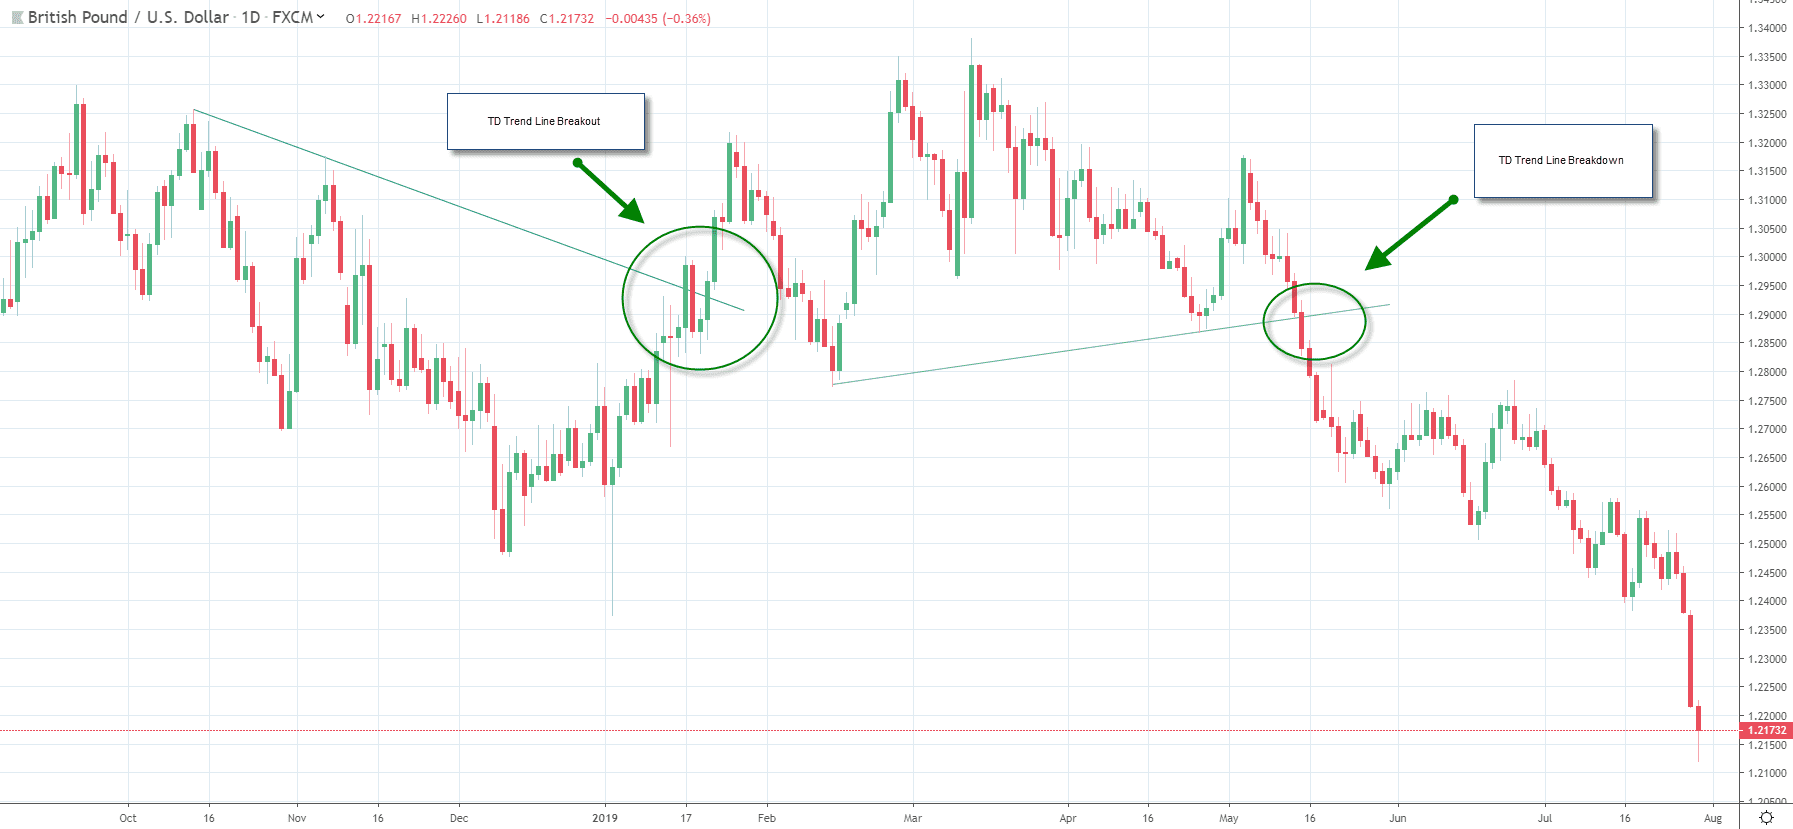
To create a TD trend line, break out, you want to connect the most recent TD pivot high that is surrounded by 1,2, or 3 lower highs to the next TD pivot high that is surrounded by 1,2, or 3 lower highs. DeMark states that you want to use the same number of preceding or succeeding lows when generating a TD trend line. Additionally, the first of the TD pivot lows should be higher than the succeeding TD pivot high which should generate a downward sloping trend line. TD trend line that point to a TD break out are always downward sloping or horizontal but are never upward sloping.
Set Up to the TD Trend Line Breakout or Break Down
The setup for a breakout or a breakdown is based on supply and demand. DeMark designated the close the most important point when determining if the price of an asset was slicing through support or resistance. By connecting a TD pivot low to the prior TD pivot low, you could generate a TD trend line. When the slope of the trend line is broken, a break down would occur. The slope of the trend line is created by extending the TD trend line to a point in the future based on the slope created by connecting a TD low to another TD low. The same is true when generating a TD resistance trend line that will generate a breakout.
The setup, which signifies that an asset has broken out above or below a TD trend line, occurs when the close of the period you are using crosses above (resistance) or below (support). The closing price is key as it tells you that the market is willing to go home for the day and is comfortable with a price that has broken out or broken down. DeMark used the daily, weekly or monthly price to determine a breakout or breakdown, but the TD methodology will also work with intraday prices.
In addition to using the close to designate a breakout or breakdown, there is a setup that allows you to determine that intra-day pricing is breaking out. If the close of the asset you are trading is down on the day prior to an upside breakout, intra-day breakout could be considered viable trigger. If the close on the day prior is up for a TD break down, and intra-day breakdown could be considered a viable trigger.
DeMark also described the level you should consider entering a position after a signal that is triggered by the close. When prices break out, you want to purchase the asset as near to the close as possible and might consider waiting for prices to retest the TD trend line in the subsequent day or days. You can use the same technique for a breakdown.
A TD line breakout or breakdown is disqualified when the close reverses through the TD line.
TD Line Projections
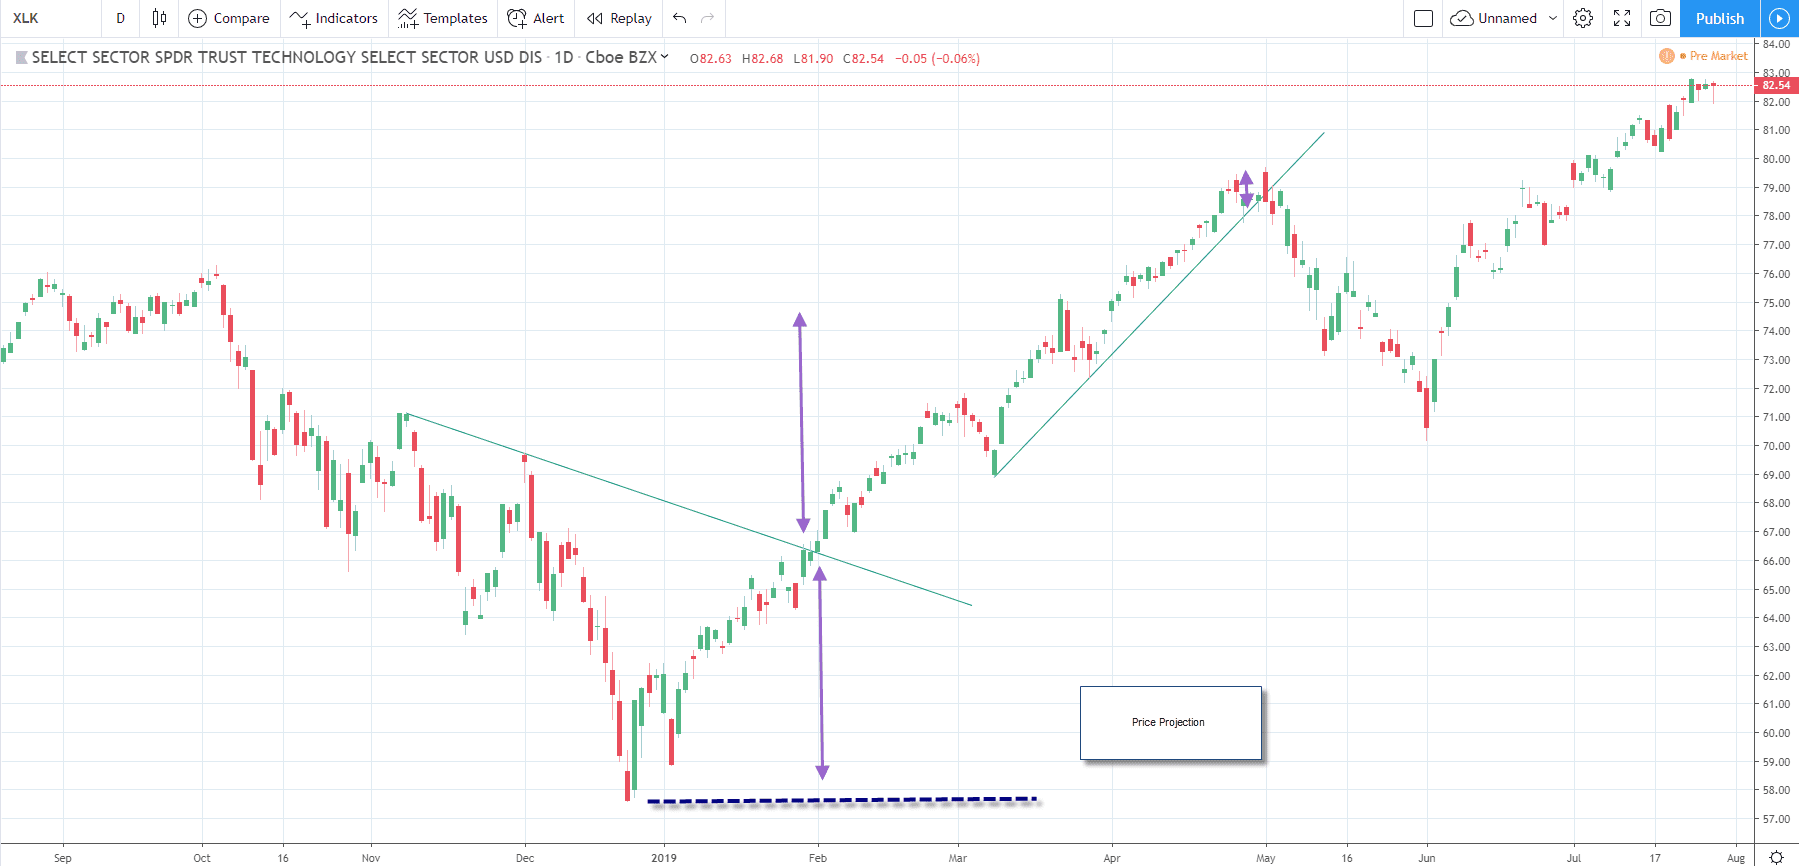
DeMark provides a guide to determining the price projections which can be used to generate a risk management framework. The guide assumes that you are willing to risk $1 for every $1 that you risk. DeMark provide the concept of symmetry. He points to the lowest low (or higher high) under (or over) the slope of the TD trend line and uses the distance between the trend line breakout point and the low (or the high) under (or above) the trend line as the projection for prices.
In subsequent years following the first publication of the book in 1994, there have been many other projection guides. One such guide is to use a specific percentage. For example, if you plan to risk 2%, the reward you should expect from a TD breakout or breakdown should be 2%. The idea is that you will win more than you lose when using the TD strategy.
Using the TD Line Strategy
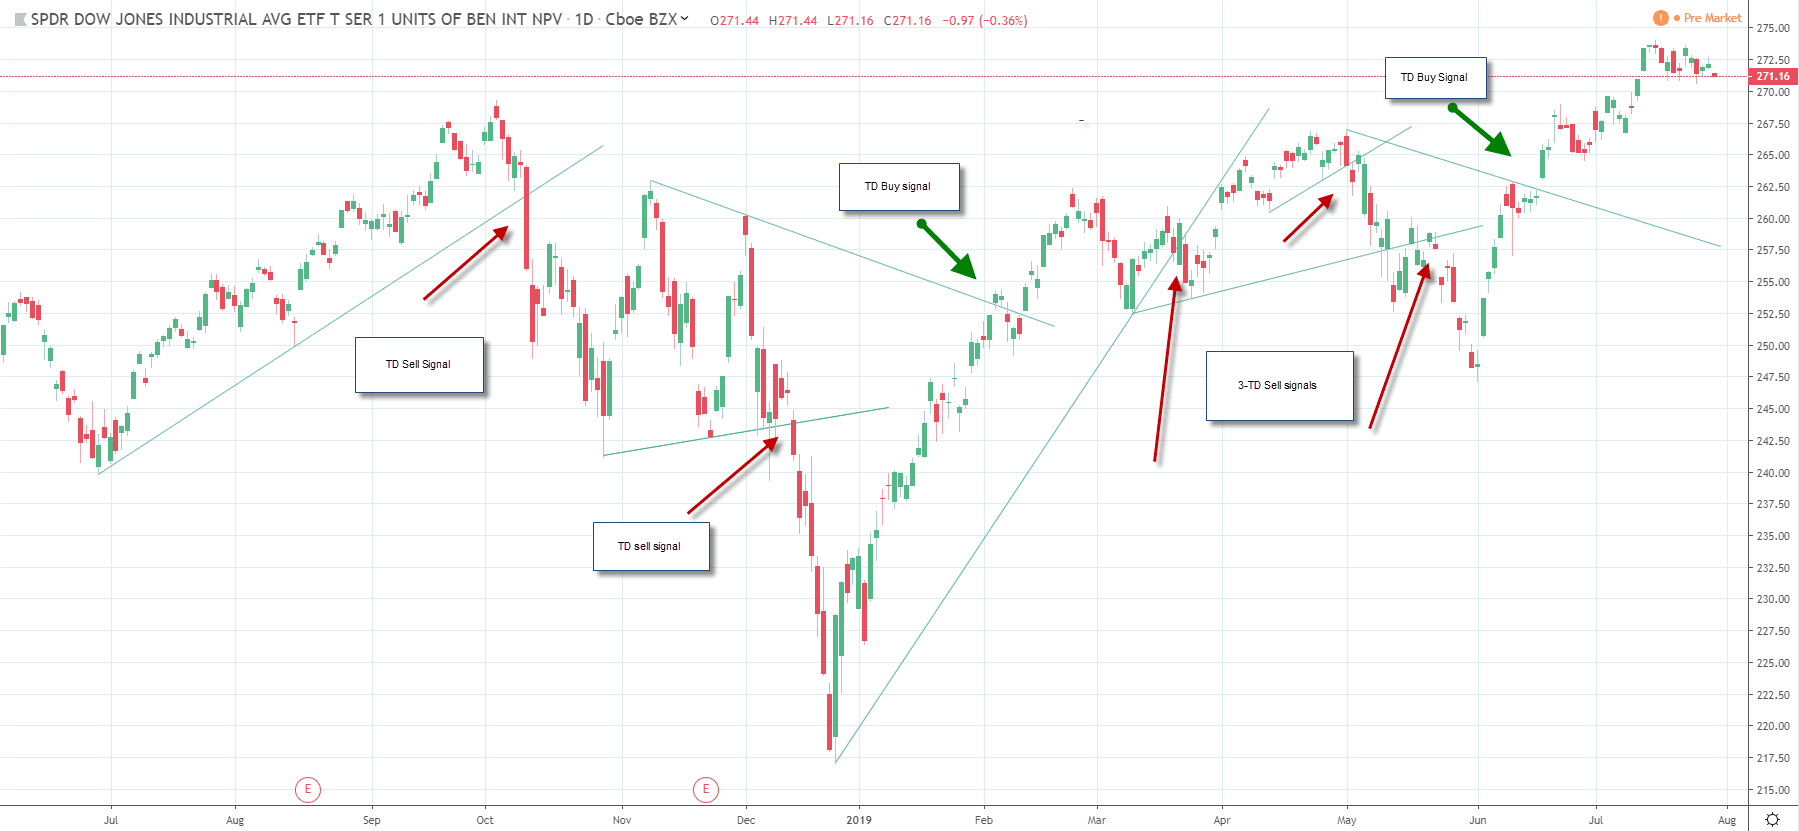
The chart above shows you daily TD buy and sell signals. Prior to using these signals, you should back test using specific risk criteria. You can attempt to make your TD signals automated using a system that generates objective TD signals with specific risk criteria. If you risk 2% for every 2% you expect to gain, the results of the TD signals are as follows.
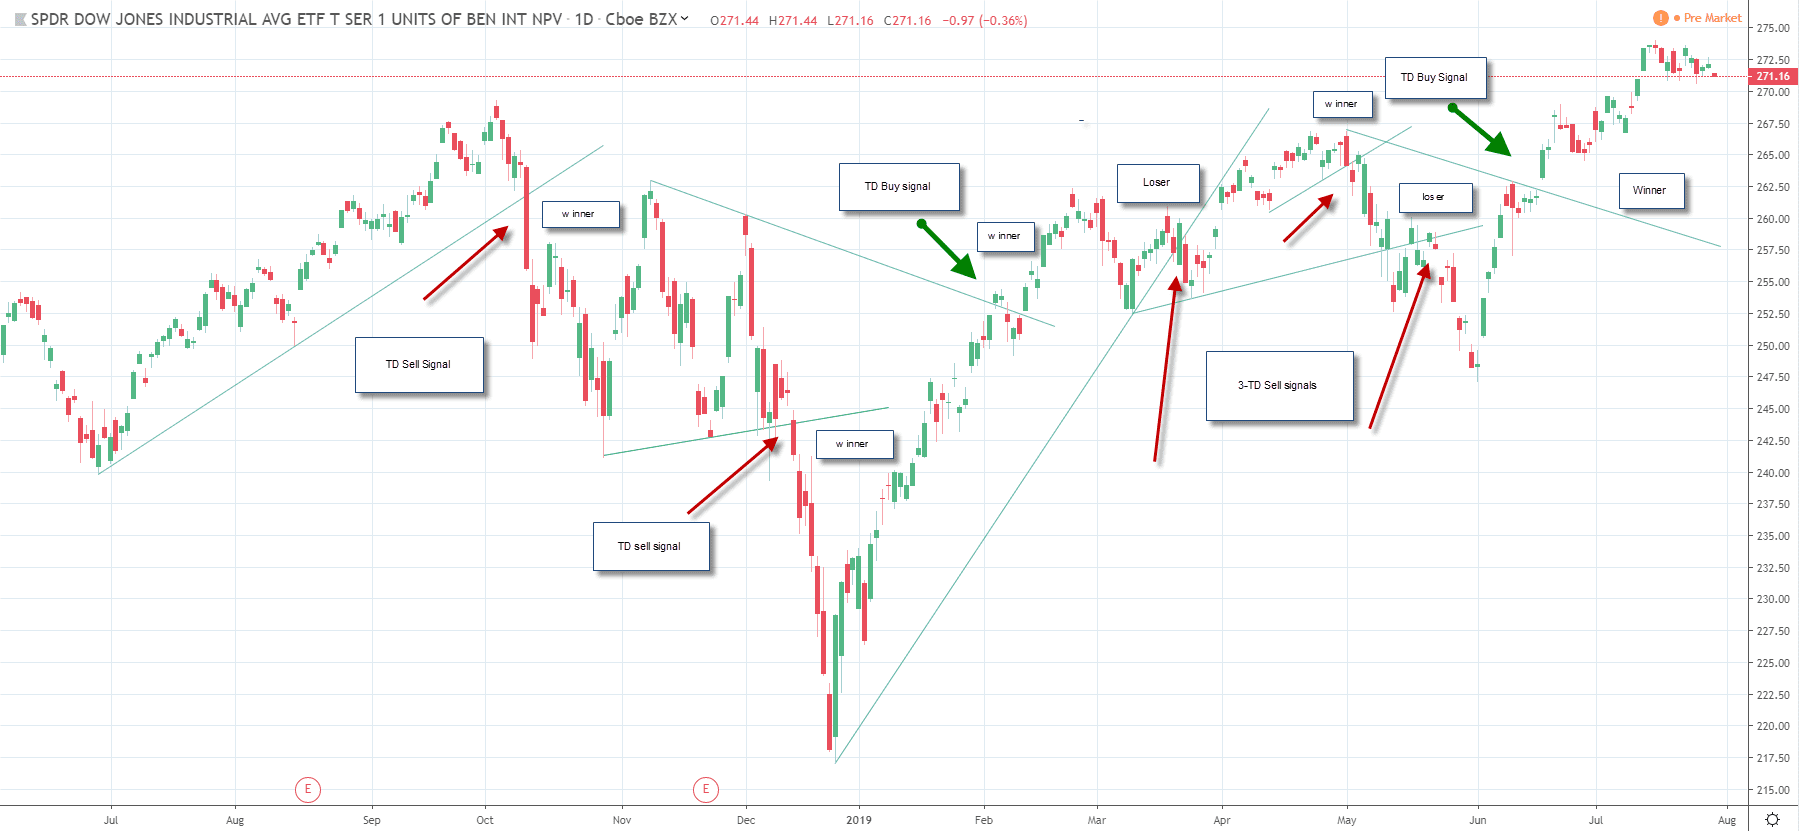
You would win 71% of the time (win 5, lose 2) if you risked 2%, to make 2%, using the close of the trading session to confirm the TD breakout. In many cases the TD signals appear to work more efficiently if you provide the trend to develop. This means short-term trading with tight stops could be unsuccessful. Using the TD trend line breakout for daily closes, if preferred.
SUMMARY
- TD pivot points help determine supply and demand and therefore are excellent points to use to draw trendlines.
- TD pivot points are created by surrounding a higher by 1,2,3 lower highs or a low surrounded by 1,2,3 higher lows.
- TD Trend lines connect a TD pivot high with the next higher TD Pivot high, or the TD Pictor low connected with the next lower TD pivot low.
- A TD break out occurs when the price of an asset close above a down sloping TD trend line. A TD price break down occurs when the price of an asset closes below an upward sloping TD trend line.
- You can buy an asset after a TD upside breakout or wait until the price retraces to the trendline.
- You can use TD price projections or specific percentage to determine your take profit projections.
- If you are using TD projections, your risk on each trade could be variable.
- Your risk should be commensurate with your reward. Risking $1 for every $1 you make is a prudent risk management strategy.
PEOPLE WHO READ THIS ALSO VIEWED:


