
The Pennant Pattern Explained
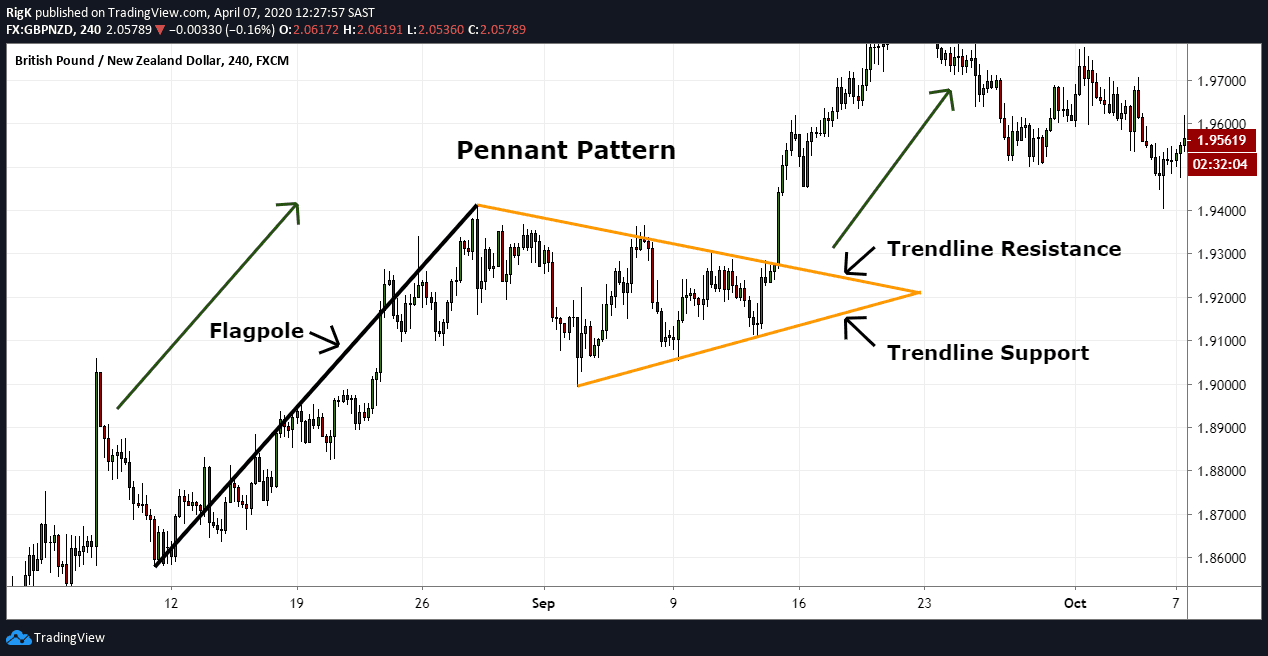
The pennant is a continuation chart pattern that appears in both bullish and bearish markets. Traders follow this pattern to predict whether a market is getting ready to resume a previous trend after a period of consolidation. During the consolidation phase price structure tends to move sideways within a narrowing range before a breakout occurs.
The first chart example above shows a bullish pennant pattern that formed in the GBP/NZD currency pair. Pennants consist of a flagpole that precedes the consolidation phase and two trendlines that looks like a tapering flag, hence the name ‘pennant’.
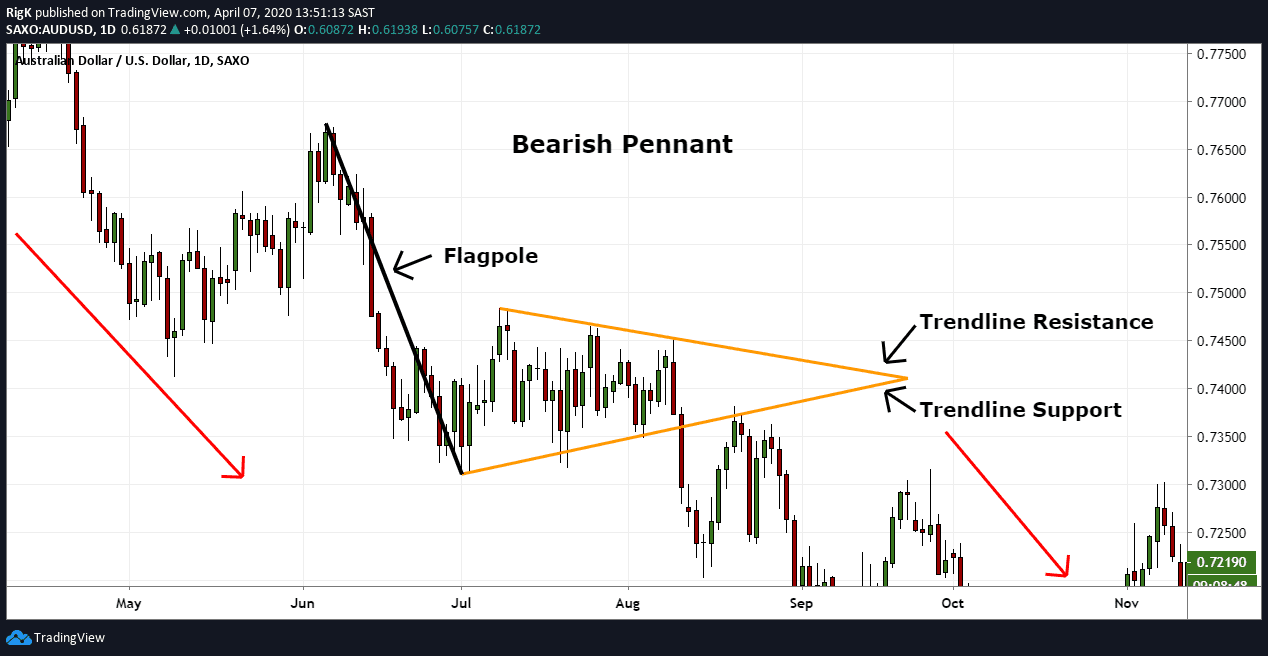
Here we have a bearish pennant that took more than a month to complete in the AUD/USD currency pair. Note how price broke out of both this and the previous example with an increase in momentum, which is a common characteristic of how price behaves once these patterns complete.
How to Trade the Pennant Pattern
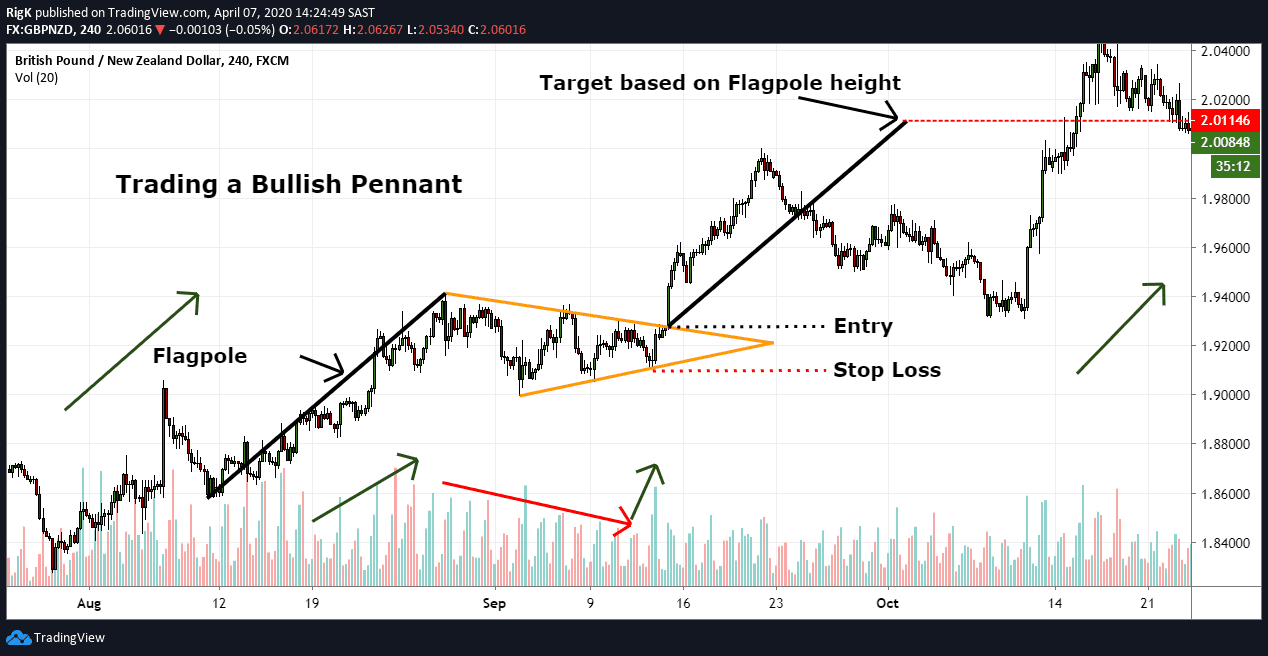
Using our previous bullish pennant pattern, traders will often execute a long position once price breaks above the upper trendline resistance and target a level equal to the height of the flagpole. A stop loss can generally be placed a few pips below the final swing low prior to the breakout.
Traders Tip: Both bullish and bearish pennant patterns will generally display certain characteristics during their formation which can help a trader qualify whether this pattern will present a good trading opportunity or not.
- Firstly, it will be a good idea to watch how volume reacts leading into the pennant and how volume behaves during the pennant formation. When you see an increase in volume during the flagpole part and a decrease in volume during the pennant phase, then that is a good sign.
- Secondly, you typically do not want to see the pennant formation retrace more than 50% of the flagpole, otherwise, you might be dealing with a triangle pattern rather than a pennant.
- Lastly, an increase in volume before the breakout is often a good indication that the pattern completed.
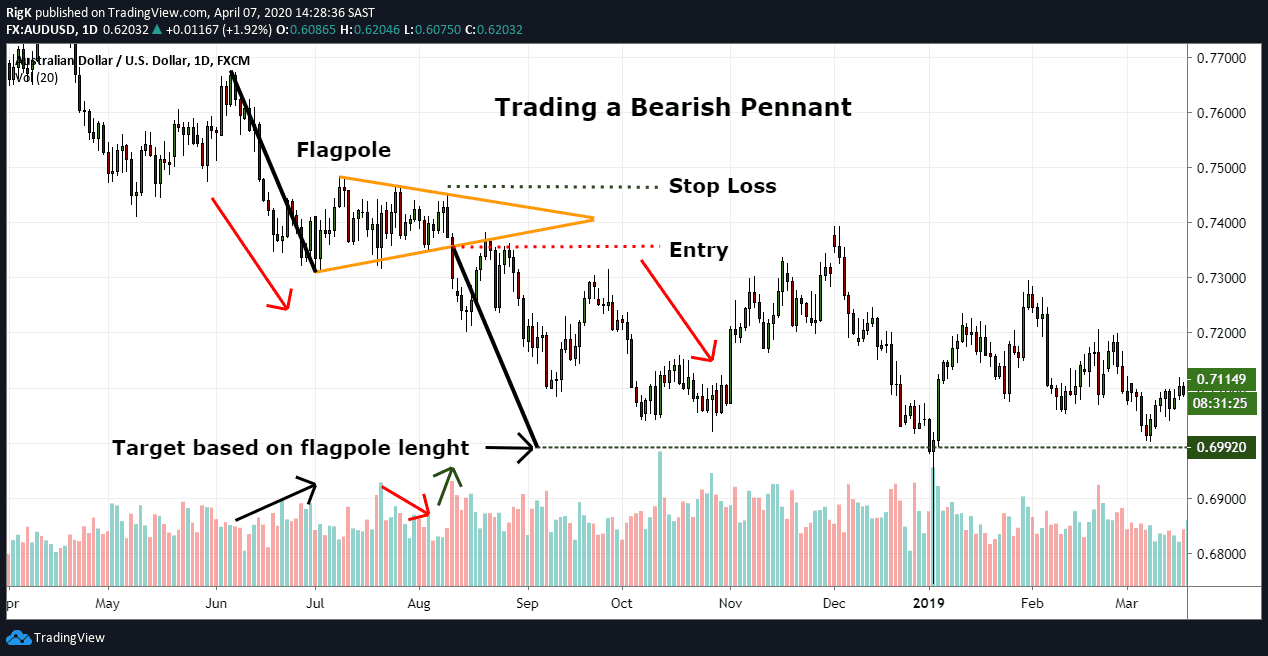
My final chart shows the same bearish AUD/USD pennant pattern that was presented previously and displays similar characteristics from a volume and retracement perspective.
Note: Bearish pennant patterns will not always show a notable decline in volume during the pennant formation since bearish markets generally move faster due to the underlying fear and anxiety that drive a sell-off. This is evident in the example above where volume only started decreasing during the latter part of the formation.
The pennant pattern is a powerful trend continuation pattern that appears in all markets and timeframes. When these patterns end, they typically lead to strong breakouts that raise the probability that a trend has resumed with decent follow-through.