
What is a Stop-Loss Order?
A stop-loss order automatically closes your position at the pre-specified price if a trade moves against your expectations. It’s one of the major building blocks of risk and money management, as it helps with protecting your capital, calculating risk-per-trade and reward-to-risk ratios, as well as opening trades with the correct position size to remain within your risk management guidelines. Without stop-loss orders, there is not much traders could do if their trades went against them (except closing them manually).

Example of a stop-loss order:
Let’s say that you buy 100 stocks that trade at $10 each, meaning your total position size equals to $1,000. If you don’t want to risk more than $200 on that trade, you could place a stop-loss order at $8, which would automatically close the position and sell the stocks if the price falls to $8 per share. If your analysis proves correct and the stock’s price keeps rising, your stop-loss order would not be executed. In this regard, a stop-loss order is a type of a pending order, which becomes a sell at market order at the pre-specified price and sells your long position (closes the trade). Similarly, a stop-loss order becomes a buy market order when you are short-selling the stocks, and closes your short position at the pre-specified market price.
Place Stop-Loss Orders on All Your Trades
All your trades should have stop-loss orders to protect your trading capital. Even if just one trade without a stop-loss order goes against you, there is a risk of losing a substantial amount of your trading account. Recovering from large losses is not an easy endeavour, as the trader will have to make more (in percentage terms) than you have lost, just to return to your initial trading account size.
The following table explains this situation:
| Amount of Balance Lost | Amount Necessary to Return to Initial Balance |
| 10% | 11% |
| 25% | 33% |
| 50% | 100% |
| 75% | 400% |
| 90% | 1,000% |
If you lose 10% of your trading account, you need to make 11% in order to return to breakeven. Losing 25% of your trading account calls for 33% and losing 50% of your trading account needs 100% of profits to return to your initial balance size. While stop-loss orders don’t make you automatically a profitable trader, they can at least prevent the accumulation of large losses. That is why using a stop loss in trading is extremely important. Stop-losses need to be a part of your risk management and overall trading plan.
Types of Stop-Losses
Stop-losses can be grouped by the rules that you apply when setting them. The following types of stop-loss orders exist:
- Equity Stops – These are based on a percentage of your trading account. For example, you can set stop-losses to close your position once your account size falls for a certain amount in percentage terms.
- Chart Stops – These are stop-losses based on price-action and support/resistance zones. Charts stops are the preferred type of stop-losses used by traders, as they use major price-levels which need to be respected in order for a trade setup to remain valid. An example of a chart stop is a stop-loss placed just above a resistance level or just below a support level. Naturally, those levels represent an obstacle for the price and if they’re broken, the trade setup may not be valid anymore.
- Volatility Stops – If you place a stop-loss order based on the average price-volatility of the traded instrument, you have a volatility stop. Traders who use volatility stops assume that the current volatility may not be enough to stop them out of a trade, but they don’t want to remain inside a trade if the volatility starts to work against them. Indicators such as the Average True Range can determine where a volatility-based stop-loss should be placed.
- Time Stops – Time stops close your position after a certain period of time has passed. This can be the end of the trading day, end of the trading week, etc.
Stop-Loss Orders and the Risk-per-Trade
As we’ve already said, risk management is assisted by the placing of stop-loss orders. One of the most important concepts in this regard is the risk that a trader is taking per trade, also called risk-per-trade.
Your risk-per-trade determines how much of your trading capital is at stake if a trade goes against you. If we take the example from earlier in this article, your risk-per-trade would equal to $200.
However, a more efficient approach would be to determine a percentage of your trading capital as the maximum risk you want to take on any single trade. The golden rule of risk management is not to risk more than 1-2% of your balance per trade, meaning that if you have a $10,000 trading account, the maximum you should risk is between $100 and $200 per trade. This helps to prevent losing too much of your trading capital if you experience a losing streak, and stop orders play an important role in this.
Chart stops do return the best results in the long run, but the total risk you’re taking should be expressed as a percentage of your trading account. How to combine these two concepts will be explored below.
Stop-Losses and Reward-to-Risk Ratios
Another important concept in risk management is the reward-to-risk ratio of a trade and stop-loss orders are again a key part of this. The reward-to-risk ratio is simply the ratio of your potential profit and your potential loss on a trade.
If you buy 100 stocks for $10 each and expect the price to rise to $12, but don’t want to hold the trade if the price falls to $9, your potential profit of $200 ($2 x 100 stocks) and potential loss of $100 ($1 x 100 stocks) would return a reward-to-risk ratio of 2. The following chart shows how stop-losses are used to determine the reward-to-risk ratio of a trade.
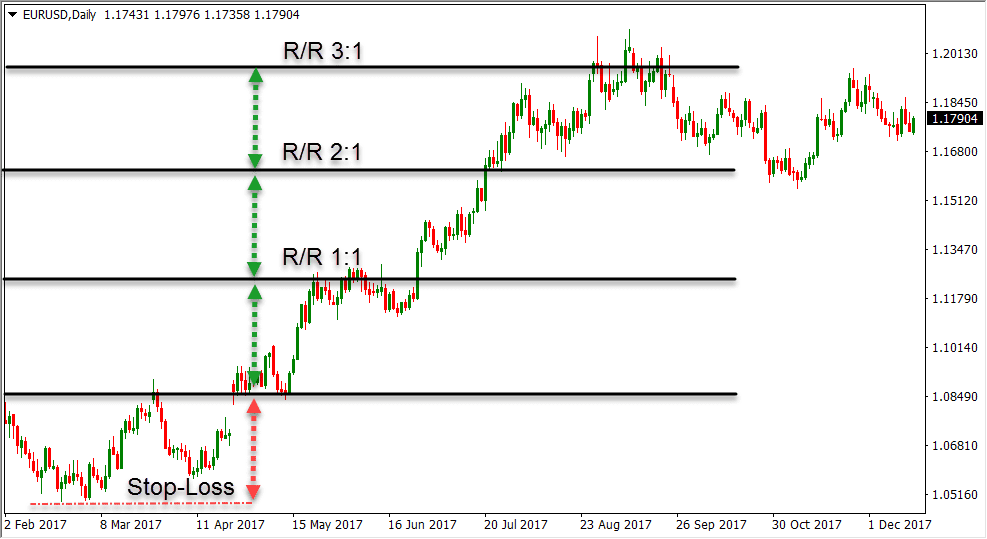
A R/R ratio of 2 means that for each winning trade, you can have two losing trades and still be at breakeven. This reduces the possibility of overall losses, particularly if you have a solid winning rate.
Research has shown that traders who follow a reward-to-risk ratio of at least 1 are more profitable in the long run. Your trades should have a reward-to-risk ratio of at least 1 and ideally 2 or 3, and you should use stop-loss orders to determine the downside risks of your trades.
How to Use Stop-Losses to Calculate Your Position Size?
Perhaps one of the most important aspects of stop-loss orders is that they can be used to determine the perfect position size for any trade. Position sizing refers to the maximum size of your trade which ensures that you stay in your risk-per-trade boundaries.
How to calculate your position size based on the size of your stop-loss order is covered below in three simple steps:
Step 1: Determine the size of your stop-order – The best way to do so is by taking into account the current market environment and by identifying the price where your trade setups would become invalid. If you’re using a chart stop, this could be just above a major resistance or just below a major support. For the purpose of this demonstration, let’s say that your stop-loss is $2 away from your entry price.
Step 2: Calculate your risk-per-trade – The next step includes the calculation of the risk you’re willing to take on that trade. If your account size is $10,000, and you don’t want to risk more than 2%, your maximum risk-per-trade would equal to $200.
Step 3: Calculate your position size – Now that you know the size of your stop-order ($2) and the maximum risk-per-trade based on a percentage of your trading account ($200), simply divide your risk-per-trade and stop-loss size to get the total number of stocks you need to buy or sell. In our case, this would equal to 100 stocks ($200/$2).
Stop-Losses Are Not Completely Risk-Free
While using stop-losses carries many more advantages than disadvantages, traders need to be aware that stop-losses are not completely risk-free. A stop-loss order doesn’t guarantee that your trade will be closed at the pre-specified market rate. As stop-losses are pending orders until they become market orders, the price at which the market order gets filled could be some distance in price away from the price that the stop was placed.
While stop-losses usually close your position exactly at the desired price, market imbalances and increased buying and selling pressure may create “slippage” and execute your stop-loss at a less favourable price. The price at which you place your stop-losses can accentuate this problem even more. If a large number of traders place their stop-losses around support and resistance levels for example, the amount of stop-losses that are being executed when those levels are broken can create significant volatility and a widening of the bid/ask spread. As a result, your stop-order may be filled at a different price than stated. This is “slippage”.
Extremely large market imbalances, known as “Black Swan Events”, represent the largest threat for stop-loss orders. Black Swans Events are unanticipated market events that occur in times of sudden natural disasters or political and economic surprises. In early 2015, the Swiss National Bank stunned markets when it lifted its 1.20 EUR/CHF peg. As a result, the Swiss franc soared 30% against the Euro and stop-losses on long positions were not executed, leaving many traders (and brokers) with huge losses.
Summary of Stop Loss Orders
Stop-loss orders are pending orders which become regular buy and sell market orders once a certain price level is reached. The primary purpose of stop-orders is to protect your trading account in case a trade moves against you (to a loss position).
The type of stop order is determined by the rules that you apply when determining where to exit your trade. In this regard, stop orders can be grouped into equity stops, chart stops, volatility stops and time stops. Among these types of stop-losses, chart stops usually return the best results as they are based on the current market environment in determining the best place to exit your trade.
Stop-loss orders play a critical role in risk management and are used to help measure the risk-per-trade, reward-to-risk ratio and optimal position size. Determining the optimal position size involves the determination of your stop-loss size and your risk-per-trade, in order to calculate the optimal amount of stocks (or other financial instruments) to buy or sell.
Finally, traders need to be aware that stop-losses are not risk-free. They don’t guarantee that your trade will be closed at the specified price.
PEOPLE WHO READ THIS ALSO VIEWED:
