
Domestic and international investors are snapping up opportunities to buy into Indian success stories, and the trend is showing little sign of slowing down. The secret to successful investing is to spot momentum and trade in the same direction that it is heading. That’s the reason why many are still moving into the space and buying up the best undervalued stocks in India.
Despite the incredible price gains, there are still some stocks that look like they have to date been overlooked. Despite the broader market rising up, some stocks still appear undervalued.
This review will lift the lid on five undervalued stocks in India and outline the tips and tricks to make trading them as safe and rewarding as possible.
 WELCOME BONUS - Free Share Bundle When You Invest £50!
Get up to £500 cashback for investing with IG.
WELCOME BONUS - Free Share Bundle When You Invest £50!
Get up to £500 cashback for investing with IG.
Nifty 50 Index – Daily price chart 2015-2021
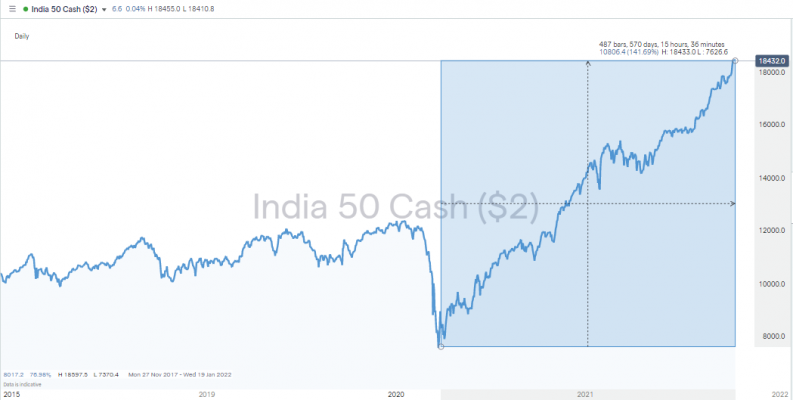
Source: IG
Best Undervalued India Stocks
1. Tata Motors Ltd
Automobile manufacturer Tata Motors offers a full suite of vehicles to a global client base. Its operations are based in India, the UK, South Africa, South Korea, China, Austria, Brazil and Slovakia. It makes cars, SUVs, trucks, buses, defence vehicles and electric vehicles (EVs).
The last item mentioned in the portfolio of vehicles, EVs, is beginning to excite investors as the firm moves into the final quarter of the year, a time when the holiday season typically boosts sales.
Tata Motors’ overall share of EV sales in its 2020 reports stood at 43.3%, and, according to an official statement, this booming markets is “poised for further growth in 2021 and beyond”. Elon Musk and Tesla may be dominating the prestige end of the EV market, but entry-level EV sales can be expected to skyrocket once the tipping point in terms of EV charging infrastructure is reached. The network needed to support EVs isn’t quite ready yet, but it’s a case of when, not if, it materialises.
The firm has announced plans to turn debt free by 2024 and has been selling stakes in Tata Technologies Ltd and Tata Hitachi Construction Machinery Company Pvt Ltd to meet that aim.
Tata Motors Ltd – Daily price chart 2015-2021
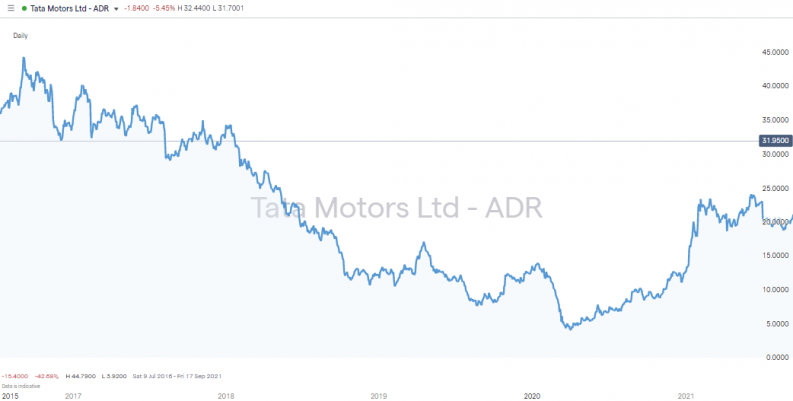
Source: IG
Tata Motors Ltd – Daily price chart 2018-2021
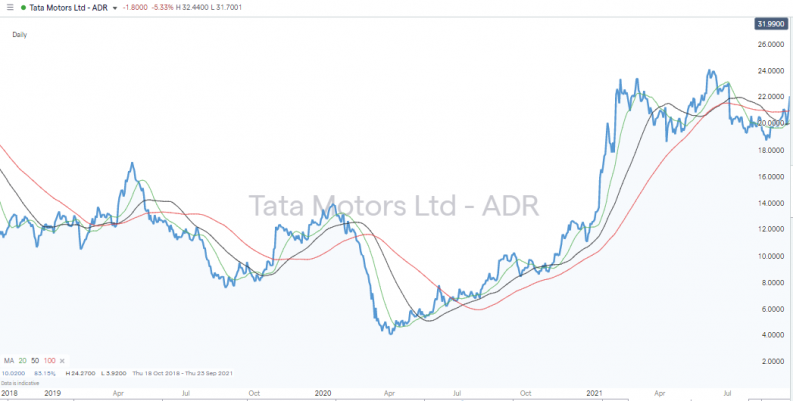
Source: IG
Tata Motors has a market cap of $19.87bn, which offers some security to investors, and the dividend yield of 0.058% can be expected to improve as debt is offloaded from the balance sheet. If the firm starts returning more cash to investors, big institutional funds can be expected to move in to buy Tata Motors stock and those buy-and-hold style investors will offer long-term support to the share price.
The daily share price chart shows current price action leading the 20, 50 and 100 Simple Moving Averages higher since March 2020. The price consolidation during the first part of 2021 has seen price plateau, and with no real signs of the stock giving up ground, the path of least resistance appears to be upwards.
Tata Motors Ltd – Fundamentals
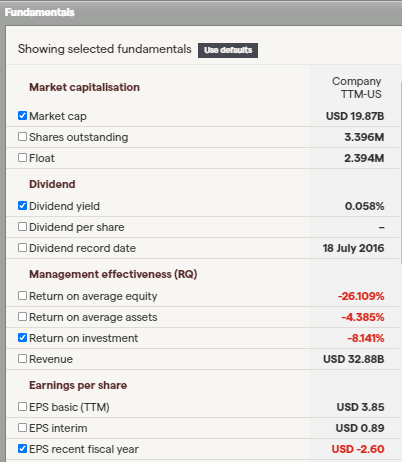
Source: IG
Exposure to the potential returns provided by Tata Motors can be gained by buying stock on the domestic market or the internationally tradeable American Depositary Receipt (ADR), which is listed on the New York Stock Exchange.
For the fiscal year ended 31st March 2021, Tata Motors Limited (ADR) reported that:
- Revenues decreased 4% to RS2.482tn
- Net loss increased 25% to RS142.7bn
- Revenues reflect Jaguar and Land Rover segment decrease of 7% to RS1.927tn
- Commercial Vehicle segment decrease of 8% to RS331.78bn
- Rest of World segment decrease of 24% to RS351.66bn
- US segment decrease of 10% to RS467.58bn
Source: IG
2. HDFC Bank Ltd
The banking sector was greatly exposed to the risks associated with the COVID-19 pandemic. The chance that debtors might default or that economic activity might grind to a halt weighed down share prices in the financial sector, and HDFC Bank was no exception.
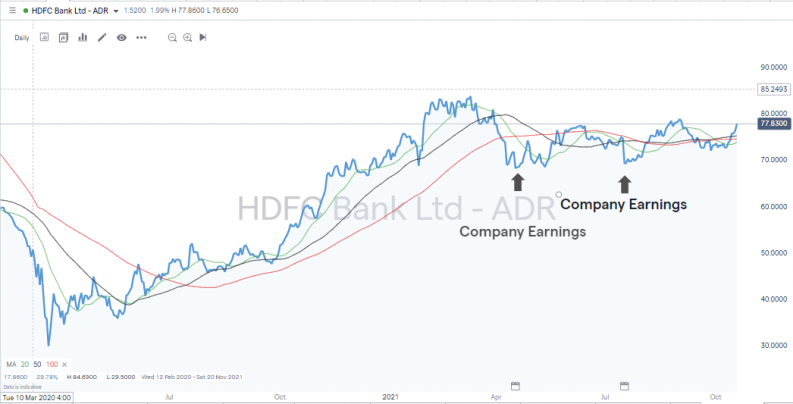
In March 2020, the HDFC Bank share price traded as low as R30.27. It recovered somewhat to trade above RS80.00 in February 2021, but has since then consolidated. Investors have been looking for some good news, and the two company earnings announcements in April and July 2021 were followed by spikes in price volatility but without the stock really taking off.
HDFC Bank Ltd – Daily price chart 2020-2021
Source: IG
From a bullish perspective, the stock is primed for take-off. The sideways trading pattern represents price action and there is strong support at the RS70.00 price level. There have been several tests of resistance levels formed by Daily 20, 50 and 100 SMAs, but if the stock was to break its year-to-date share price high of 83.79, then renewed long interest could be expected.
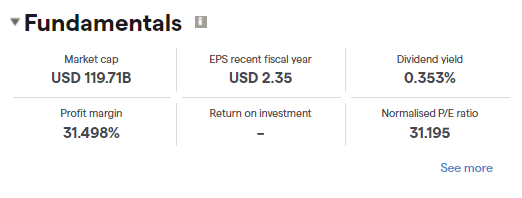
HDFC – Fundamentals
Source: IG
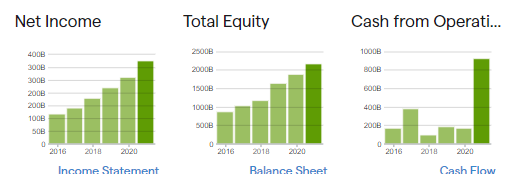
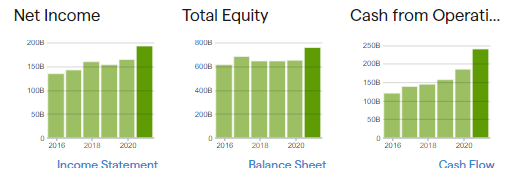
The firm pays a relatively high dividend of 0.353%, so buy-and-hold investors can expect to get some return on their capital. If they buy at current levels and the balance sheet charts point to the firm recovering from the COVID-19 pandemic as well as it could be expected to, then Net Income, Total Equity and Cash From Operations growth are all pointing in the right direction.
HDFC Bank – Balance sheet
Source: IG
For the three months ended 31st March 2021, HDFC Bank posted the below returns:
- Interest income increased 5% to RS1.276tn
- Net interest income after loan loss provision increased 11% to RS529.45bn
- Net income increased 25% to RS325.98bn
- Net interest income after loan loss provision reflects Wholesale Banking segment increase of 39% to RS126.16bn
- Retail Banking segment increase of 4% to RS391.94bn
Source: IG
3. Infosys Ltd
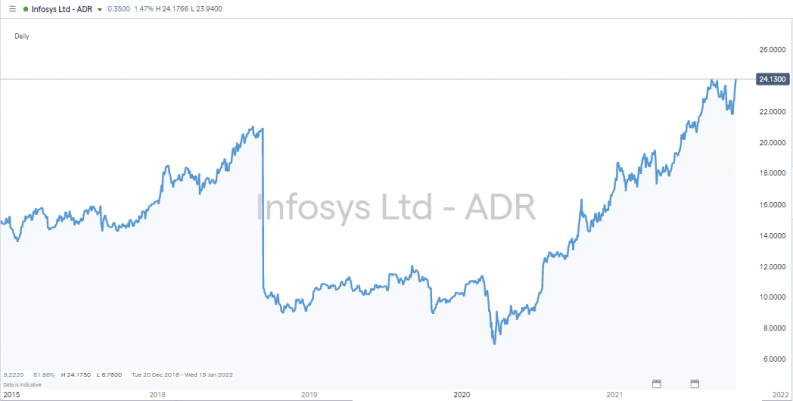
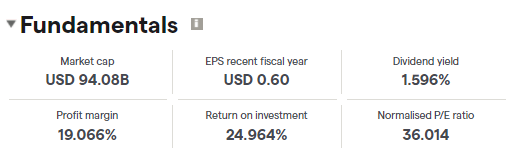
The 1.596% dividend yield generated by Infosys Ltd tells its own story. The IT outsourcing and consultancy firm has established such a strong position in the global market that it is successfully generating enough profits to be able to return excess cash to investors.
Infosys Ltd – Daily price chart 2015-2021
Source: IG
The P/E ratio of 36.014 is relatively high compared to other firms in the Nifty 50, where the average for the index is 27.72. There is, though, little reason to think that the price can’t still move higher. Infosys is building market share thanks to a paradigm shift in global business practices. Following the COVID-19 pandemic, the move to remote working has opened the door to the firm establishing relationships with new clients.
Infosys – Balance sheet
Source: IG
The growth potential is reflected in the profit margins of 19% and market cap of $94.08bn, which demonstrates that the firm is a major player in an already booming sector.
Infosys – Fundamentals
Source: IG
Infosys has benefited from some outsourcing operations being fast-tracked following the COVID-19 pandemic, which is reflected in some impressive performance data for the three months ended 30th June 2021:
- Revenues increased 18% to RS278.96bn
- Net income increased 23% to RS51.95bn
- Revenues reflect Financial Services and Insurance (FS) segment increase of 24% to RS92.17bn
- Retail, Consumer Packaged Goods, and Logistics (RCL) segment increase of 23% to RS41.75bn
- Manufacturing (MFG) segment increase of 20% to RS27.02bn
- North America segment increase of 18% to RS172.06bn
Source: IG
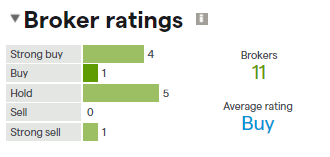
Infosys – Broker ratings
Source: IG
Analyst ratings for Infosys average out at a ‘Buy’ rating. Four analysts tip the firm as a ‘Strong Buy’ and one as a ‘Strong Sell’. A diversion of opinion on this scale is a sign that the risk-return on the firm is somewhat higher than the market average. It might not be undervalued to the extent that justifies going ‘all in’, but seismic changes such as those seen in 2020 and 2021 are infrequent events, and making the right calls on such trends can be highly profitable.
The shares can be traded using local brokers or using the ADR version of the stock, which is listed on the New York Stock Exchange and available to trade at offshore brokers.
4. Reliance Industries Ltd
Reliance Industries offers an opportunity to buy into the broader success story of the India economy. The firm operates in a wide range of sectors, including energy, petrochemicals, gas production, retail, telecoms, textiles and media.
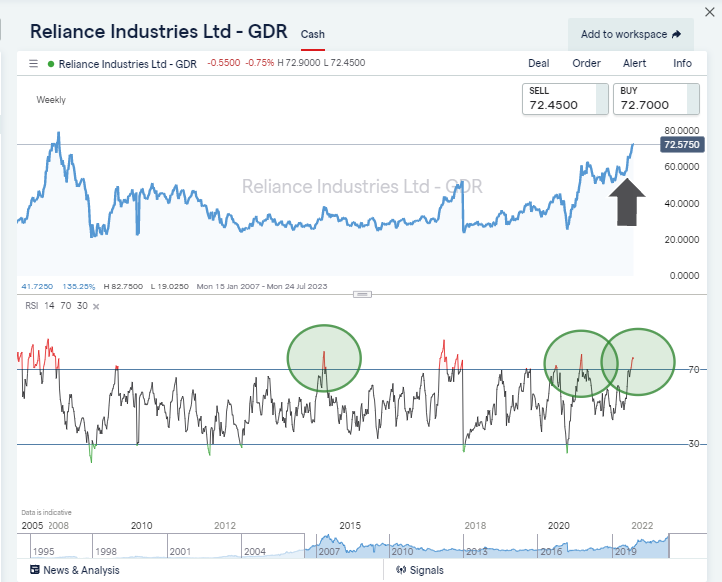
Reliance Industries Ltd – Daily price chart 2015-2021
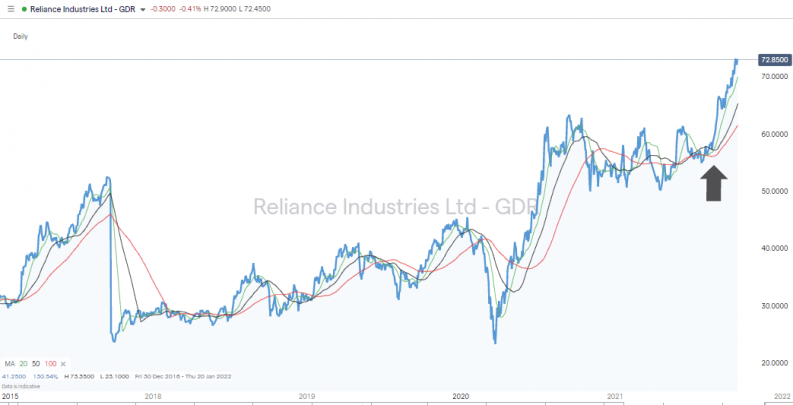
Source: IG
On a daily time-frame, the Reliance Industries share price is trading above the 20, 50 and 100 SMA, and all three of those averages have been in a bullish pattern since 25th August (black arrow).
Reliance Industries Ltd – Daily price chart 2015-2021 – with RSI
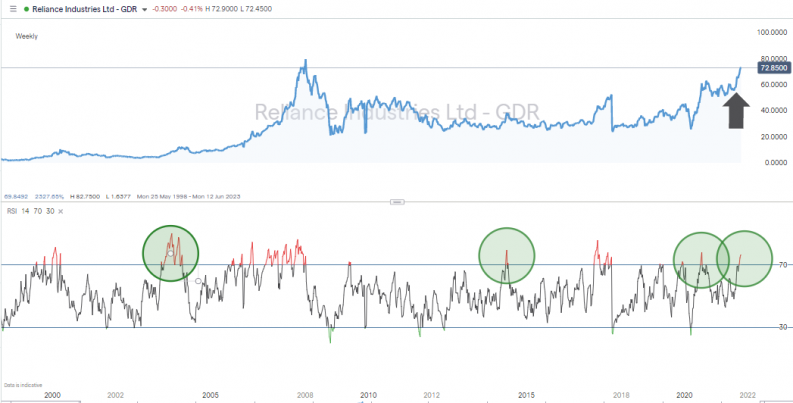
Source: IG
The Weekly RSI is >70, but the historical price chart shows that the firm has been in this position before and price still continued to rise. The exposure that the firm offers to a diverse range of sectors, from oil to digital, puts it in a position to thrive on the back of the India economy regaining momentum following the COVID-19 pandemic.
The major risk to the share price is that a new variant of COVID-19 surfaces and brings about more economic hardship, but those with a glass-half-full approach to medium and long-term growth prospects will spot that the firm’s P/E ratio of 33.95 is still below the 10-year high for that metric, 37.12.
Shares in the firm can be bought on the domestic exchange, but in an effort to make things easier for international investors, offshore brokers offer a Global Depositary Receipt (GDR), which is available through offshore brokers.
5. ICICI Bank Ltd
Things haven’t been easy for banking stocks over the last few years. The COVID-19 pandemic increased the risk of client defaults and brought economic activity to a standstill. Even before the events of February 2020, financial services firms such as ICICI Bank were battling against a low interest rate environment, which is one where banks have their profit margins squeezed.
ICICI Bank Ltd – Daily price chart 2015-2021
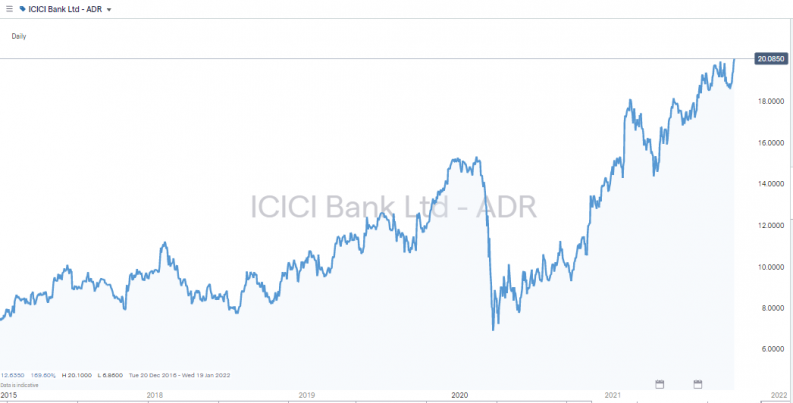
Source: IG
With inflationary pressures building, all eyes are on higher interest rates and an environment where it’s easier for banks to profit on wider bid-offer spreads on credit and debit balances. With a paradigm shift in economic fundamentals appearing likely to happen, now could be the time to buy into undervalued bank shares. There is also the fact that only the strongest, such as ICICI Bank, have weathered the perfect storm of low rates and COVID-19 to be in a position to grab market share from banks that haven’t performed so well since 2020.
ICICI Bank – Balance sheet
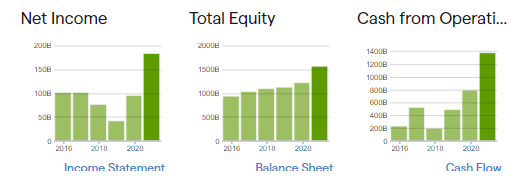
Source: IG
ICICI Bank’s profit margin of 17.99% and dividend yield of 0.289% place it as one of the potential winners as the sector as a whole improves in the coming years. The P/E ratio of 22.00 also points to the firm being a good fit for those looking to buy undervalued India stocks.
ICICI Bank Ltd – Fundamentals
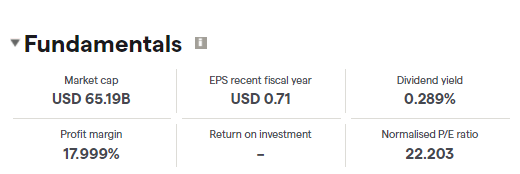
Source: IG
ICICI Bank is a big operation with a prestigious history and a market cap of $65.19bn. Some of the feeling that it is undervalued is reflected in there being only three analysts covering and providing ratings on the stock. Those ratings are positive and average out at a ‘Strong Buy’ rating, but the stock is currently flying under the radar of some international investors. If this changes, then a groundswell of buying pressure can be expected to be released.
ICICI Bank Ltd – Broker ratings
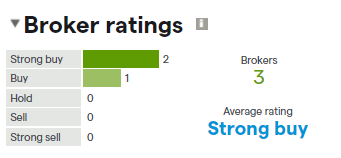
Source: IG
The financial statements for the three months ended 30th June 2021 point to the potential of the firm:
- Interest income increased 3% to RS230.97bn
- Net interest income after loan loss provision increased 85% to RS165.1bn
- Net income increased 52% to RS47.47bn
- Net interest income after loan loss provision reflects net interest margin, total % increase of 5% to 3.89%
- Other interest increased by 71% to RS12.43bn
- Interest or discount on advances or bill increase of 2% to RS156.97bn
Source: IG
How to Buy Stocks in India
There are five simple steps to follow to set up a trading account at a trusted broker and book a trade buying undervalued India stocks. First, you need to establish if you want to use a domestic or global broker. The former focus on the India market, but the latter are big-name brands that offer access to a range of markets, including India.
With some of the offshore brokers, it’s possible to trade a wide range of assets as well as India stocks, so you can trade asset groups such as crypto, forex, commodities, and much more in a range of global markets. It’s completely legal to buy stocks in India using an offshore broker.
1. Choose a Broker
The functionality of online broker sites is fairly generic. The account opening and trading processes are all completed online, so differentiating between brokers can come down to fine margins. Before you get into finding the best-fit broker for your trading, the first step is to check that your broker is safe.
There’s nothing more disappointing than making a profit on a trade if you signed up with an unregulated scam broker and get none of your cash back. Financial regulators oversee the markets and provide licences to firms that meet certain criteria. These stamps of approval have varying degrees of weight as some regulators are regarded as being more diligent than others. By choosing a broker that is licensed by one of the below highly regarded regulators, you are taking the first step towards trading safely:
- Monetary Authority of Singapore (MAS)
- Financial Conduct Authority (FCA)
- Australian Securities and Investments Commission (ASIC)
- US Securities and Exchange Commission (SEC)
- Cyprus Securities and Exchange Commission (CySEC)
- Securities and Exchange Board of India (SEBI)
The exact rules vary from regulator to regulator, but to comply with the licence terms of the strictest regulators, brokers are required to hold enough cash to be viable, hold client funds in segregated accounts, and carry out independent audits of their operations. More information on the regulatory pros and cons of different brokers can be found here.
One of the easiest and safest ways of trying out a broker is to sign up for a free demo account. Opening one of these usually requires little more than providing an email address, and in return you’ll get to try out the full functionality of the platform and trade using virtual funds.
2. Open and Fund an Account
Upgrading from a demo account to a live account, or simply signing up for a live account from scratch, is done online. The onboarding process involves following a series of prompts and providing some Know Your Client (KYC) information so that the broker can identify you. The KYC process ensures that the broker can build a profile for you and apply appropriate ‘client care’ protection, and it also means that you and only you have access to your account. The time taken to complete the process varies, but it can be completed in a matter of minutes.
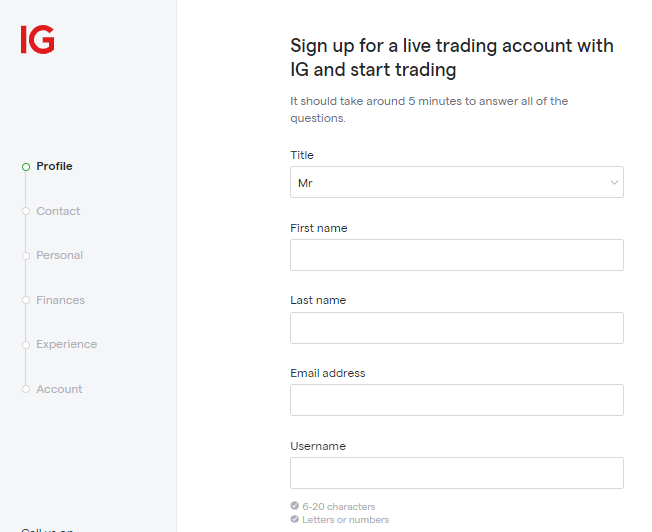
Source: IG
Once your account is set up, it’s a case of simply funding your account by wiring funds using one of the payment processing options on offer. The simplest and fastest methods have traditionally been debit or credit card payments, which are usually associated with an immediate transfer of funds. Other payment services and in particular e-payments are increasingly popular, but whichever one you use, you’ll find that the process is designed to get you trading as fast as possible.
3. Open an Order Ticket and Set Your Position Size
Once you’re set up on the platform, it’s a case of finding the undervalued India stocks that your research identified. You can do this by using the search function or filtering by country.
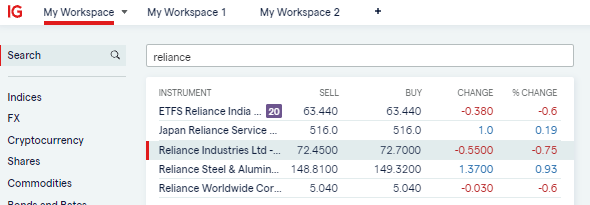
Source: IG
Each stock will have a dashboard that includes price charts, latest news and company information. Entering the number of shares you want to buy into the appropriate data fields is the next step.
Source: IG
As the India stock exchange operates during market hours, you will either need to trade while the exchange is open, or alternatively set a limit order, which is a binding contract to buy at a certain price when the market next opens. This does require market price hitting the level you stipulate.
4. Set Your Stops & Limits
Stop loss instructions and take profit orders are risk-management tools that you can build into your trade instruction. They state the price levels at which you will automatically sell out of some or all of your stock position.
Stop losses come into play if price moves against you and protect you from making further losses. Take profits work in the other direction and lock in gains.
Some buy-and-hold investors who are investing for the long haul don’t use these tools. They take the view that a short-term price crash might be something that they want to ride out. If it’s caused by a ‘flash crash’ or similar market outage, then it could close out their position at a loss for price to recover back to normal levels soon afterwards.
5. Make Your Purchase
Once everything has been checked, it’s simply a case of clicking or tapping ‘Buy’. This can be done using handheld as well as desktop devices. At the time of purchase, cash in your account will be converted into a stock position, and the value of your holding will be a function of live market prices. You’ll be able to watch the profit and loss (P&L) of that holding by accessing the portfolio section of the platform. This is also the part of the site that you access when you want to sell up some of your position. The process for selling is very similar to buying and the stock holding goes to zero, but you receive a cash credit in return.
At this stage, it is important to run some final checks. The online systems are robust and reliable, but human error can come into play. Fat-finger errors are easy to make, which is why even experienced traders check the portfolio section of their account soon after trading. Any errors are best rectified before price moves too far from where you traded.
Summary
Most of the work associated with building a portfolio of undervalued Indian stocks is done in the research and analysis stage. There is a lot of freely available information to be found online and good brokers also have specialist reports on firms.
If you choose to use a regulated broker, a lot of the process of finding a best fit comes down to personal preference – in terms of T&Cs and the ‘feel’ of the platform. Once your trade is booked, you may find that the post-trade experience has a wait-and-see feel to it.
It can take time for undervalued Indian stocks to benefit from a change in investor sentiment. If you find one that has potential catalysts in place to cause a price surge, you’ve done well. Then, once momentum builds, try not to be tempted to sell too early.
The basic principles of investment still apply, so spreading your capital allocation across a range of stock names can improve your chances of picking one that takes off. Other than that, it’s a case of keeping up to date with news events and monitoring the technical analysis and fundamental analysis methodologies used to identify the stocks in the first place.


