
This method of analysis is called Comparable Company Analysis. This valuation methodology is extensively used by professional investors, especially for listed companies. It gives investors a good way to assess if a company is cheap or expensive relative to its peers. To see how it “trades” (compares) on various financials to its peers and competitors
Various Methods – Comparable Company Analysis
At its core, Comparable Company Analysis is as the name states a way of comparing a listed company’s valuation to a subset of other listed companies’ valuation. This is done by comparing various valuation ratios or more known as “multiples” between the companies. These “multiples” are based on the ratio between a valuation metric for a company, such as Market Capitalization or Enterprise Value to some financial metrics such as Revenue, EBITDA or Earnings-Per-Share (EPS).
Comparable Company Analysis (“Comps”) is probably the most used valuation form with professional investors. Let be public market investors, investment bankers, hedge fund analysts or private equity professionals. There are two main reasons for this;
- Comps have their basis on actual market prices which the valuations are based on. This differs from DCF valuation which as we talked about earlier is based on multitudes of assumptions.
- Comps are comparably easy to perform as most of the data to conduct the analysis is extensively available for investors.
We will go through the various steps of how to build and conduct a “Comps” analysis.
Peer Universe
As a first step when conducting a “Comps” analysis of a company, one needs to find a set of listed companies that one wants to compare with. Majority of the time this list compromises of competitors, companies in the same industry (or industry vertical). For example, if one wants to make a comp analysis of General Motors (GM US), the peer universe to use would include listed domestic companies such as Ford (F US), Chrysler (FCAU US). But it would also include international peers such as Daimler (DAI GY), BMW (BMW GY), Volkswagen (VOW GY) and Toyota (TOT US).
If an investor does not know the “peer universe”, one can look through various sources to find out. Often companies will in their annual report or 10-K, have a section which they talk about their competitors. The SEC database Edgar is a great place to find company filings.
Other sources which professional investors use is “Research Reports” or online financial data providers such as Bloomberg or FactSet. As retail or private investors, if one does not have access to research reports, Bloomberg or Factset, one can always just “google” and do searches to get a better sense who the public listed peers are. Sometimes one comes to the conclusion that there is no publicly listed peer such as let say for Uber or Lyft. In those situations, one just has to use the closest publicly listed peers as possible.
Input Variables
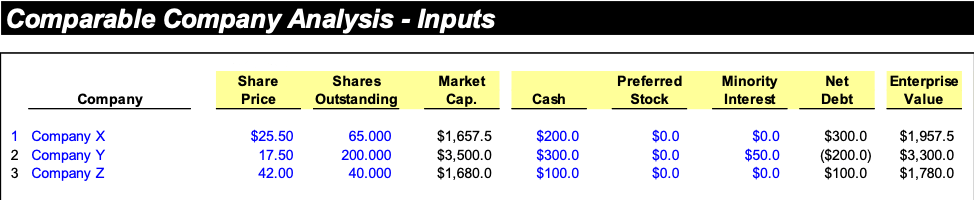
As a second step post gathering the peer universe, one needs to “spread” the input numbers for all of these companies. One needs to calculate the Market Capitalization (or also known as Market Value) and Enterprise Value (EV) for all of these companies.
Market Capitalization represents the “equity value” of the company. This valuation metric does not take into account how the company is financed, let it with debt or other types of non-equity financing.
The formula to calculate Market Capitalization is;
Market Capitalization = Share Price * Shares Outstanding
Cash: Cash is listed on the company’s Balance Sheet. It is subtracted as it a non-operating asset and one can use cash to pay down debt.
Debt: This is the combination of long-term and short-term debt as listed on the company’s Balance Sheet
Proffered Stock: Listed on the company’s Balance Sheet. It is considered as debt as it pays interest to its holders, but at the same has some equity structure as it often can be converted into shares
Minority Interest: This is basically when the company owns more than 50% but less than 100% in another company. As the company has control over the subsidiary but does not fully own it. All of the profits of the subsidiary is included in the company’s results, even though they don’t fully own it. Hence Minority Interest is treated as a liability when calculating EV.
For our purposes, we have below taken three hypothetical companies and put in numbers for them.
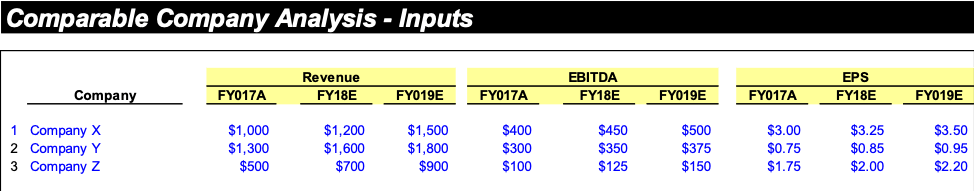
Financials (Historical and Projected)
To be able to calculate ratios/multiples, we also need denominators to our numerators (Market-Cap and EV). The inputs for our denominators are financials such as;
- Revenue: This is the top line of the company. How much the company sales of its products
- EBITDA: Is an operating metric that shows how good the underlying business is doing not accounting how it is financed.
- Earnings Per Share (EPS): This is the Net Income divided by Shares Outstanding
As we discussed in our DCF-Analysis article valuation of companies is based on future financial performance, in Comparable Company Analysis, investors like to look at multiples based on future estimates, let it be for Revenue, EBITDA or EPS. Often one includes one historical year of multiples as a reference point, but look at forward-multiples for the analysis.
As stated earlier, there are several different ways of having projections for financials when building a model. These are;
- Management Guidance: Often Managements give guidance on what they believe the company can perform.
- Analyst Estimates: Analysts often have their own estimates. One can either take the average of several analysts’ estimates or just a single one, depending on what one prefers. Majority of the time, investors takes the average (“consensus”) estimates for the analysis.
- Your own financial estimates: One might as an investor have done further due-diligence or research on a specific company and hence want put own projected financials.
Below is an example of these estimates for our three hypothetical companies.
Creating the Output Multiples
Now that we have all the inputs to calculate our multiples, we can create an output model that shows us all the different multiples that are calculated. Below are formulas how the multiples are calculated.
Operating Multiple
EV / Sales: The Enterprise value of the company divided by Sales/Revenue
EV/EBITDA: The Enterprise value of the company divided by EBITDA
Operating multiples do not care about the capital structure of the company, i.e. how much debt company has. All the focus is to see how the underlying business is performing.
Equity Multiple
P/E: Price / Earnings (Net Income) is either calculated Share-Price /EPS or Market-Cap / Net Income
Equity multiples adjust the capital structure, and the interest payments the company has.
It is important not to mix the numerator when doing the calculations. For Operating multiples, we use EV as numerator whilst for equity multiples, we use Market Cap as a numerator.
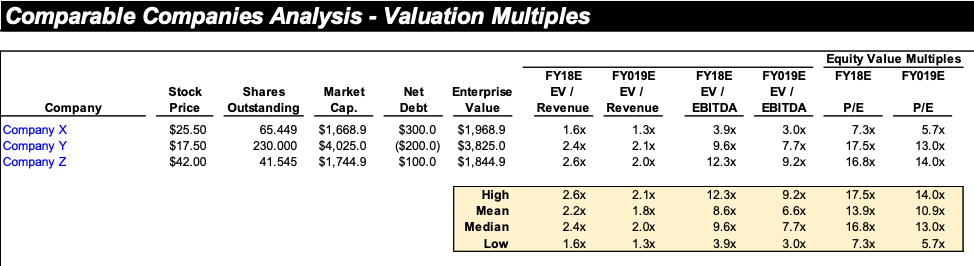
We have now calculated various multiples for our three hypothetical companies. Assume we would like to calculate what our Company Q is worth using the mean multiples from our “comps.”
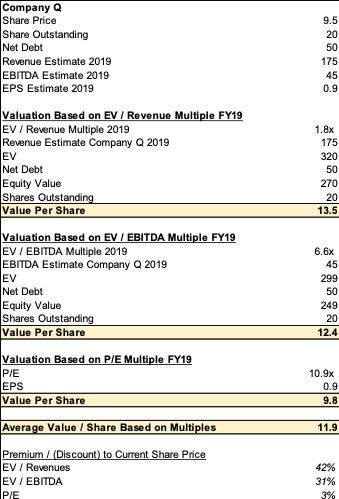
Company Q has;
Shares Outstanding: 20
Net Debt: 50
Revenue Estimate 2019: 175
EBITDA Estimate 2019: 45
EPS Estimate 2019: 0.9
Valuation based on different multiples
We can now conduct a valuation of Company Q using the mean value for 2019 Revenue, EBITDA and P/E multiples.
Valuation Based on EV/Revenue Multiple
Value Per Share = (Mean Revenue Multiple 2019 *
Revenues 2019 – Net Debt) / Shares Outstanding
“= >13.5 = (1.8x *175-50)/20”
Valuation Based on EV/EBITDA Multiple
Value Per Share = (Mean EBITDA Multiple 2019 *
EBITDA 2019 – Net Debt) / Shares Outstanding
“= >12.4 = (6.6x *45-50)/20”
Valuation Based on P/E Multiple
Value Per Share = Mean P/E Multiple 2019 * EPS 2019
“= >9.8 = 10.9x * 0.9”
Based on our comparable company analysis – We get a valuation range of $9.8 – $13.5 for Company Q using Revenue, EBITDA and P/E multiples. Below is a table with all the calculations as well.
When to use different multiples
As an analyst, it is also important to know which type of multiples work with which type of companies and what situations. In our example with Company Q, the range between $9.8 and $13.5 is a rather large range. Hence it is helpful and useful to know when to use which multiples and when to give them stronger weighting in one’s valuation decision
EV / Revenue Multiple: The revenue multiple is often used for a company that in a rapid growth phase, and is not focusing on profitability. In another words companies that have no or negative earnings. These companies are investing a lot to grow the business, which makes sales multiples the most suited multiple to use. Often, high-flying tech companies with massive growth rates are valued through sales multiples.
EV / EBITDA Multiple: EBITDA multiple is often used as a proxy for a company’s return on investments. EBITDA multiple is the best proxy to use to compare companies in the same industry as they all tend to have the same accounting metrics. EBITDA is also the most common proxy for cash-flows.
P/E Multiple: P/E multiple is extensively used valuation metric as they are easy to use and companies often report EPS directly. The downside with P/E multiple is that the company’s capital structure is taken into effect for the valuation. EPS can also be more easily be “manipulated” than Revenue and EBITDA multiple by companies through accounting tricks.
As a conclusion an investor needs to both look at the industry, what growth stage of the companies in the comps universe is, and how the capital structure might differ when deciding which multiple is most useful. As one becomes seasoned as an investor, and the more experience one gets to make these judgements.
Sanity Checking Multiples
When one conducts comparable company analysis it is important to understand why companies have different multiples. Firstly to sanity check that one’s numbers are properly calculated but also get a better underlying understanding of the multiples.
For example, most of the times multiples decline over time. This due to the fact that the denominator (assuming business is growing) increases year over year. In other words, for example, EBITDA grows over years while the EV value stays the same.
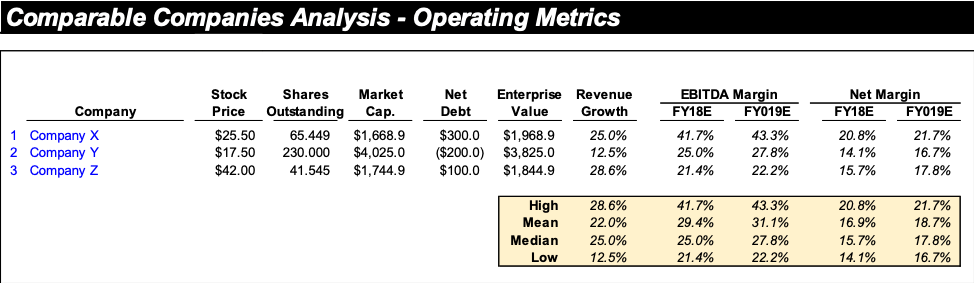
Furthermore, for a deeper understanding of the multiples, it is good to compare the different companies’ growth rates or margins. As mentioned earlier, a company with higher topline growth rate most likely have a higher revenue multiple. A company that has higher margins, tend to have higher EBITDA or P/E multiples. A good way to compare these is to do an operational metrics comp tables.
Below is an operating metrics table for our examples.
Positives and Negatives of using a Comparable Company Analysis
The main positive aspects using a “comp” valuation is that the valuation is based on market prices. In addition, the analysis is easily calculated, using public data. The valuation method gives a quick and precise way of valuing a company relative to its peers.
The main downside of a comps valuation is that the valuations are influenced by market conditions and not underlying fundamentals. In a rallying market, a “bad” company can get a higher valuation than it would in a “normal” market due to all its comps are priced higher as well. Another downside with comps valuation is that is not useful if there are no comps to for the company one is trying to value. This particularly becomes an issue for smaller companies in more niche industries.
PEOPLE WHO READ THIS ALSO VIEWED: