
In this guide, we’ll cover all about the Keltner Channel, exploring:
- What is the Keltner Channel?
- How to use it
- How to identify it (with examples)
- Advantages and disadvantages
What Is The Keltner Channel?
The Keltner Channel – named after its creator Chester W. Keltner is a volatility indicator that can be used by traders to establish both bullish and bearish positions in the market.
It offers traders a way to assess trend activity in the market and generate trading signals for a wide variety of asset classes.
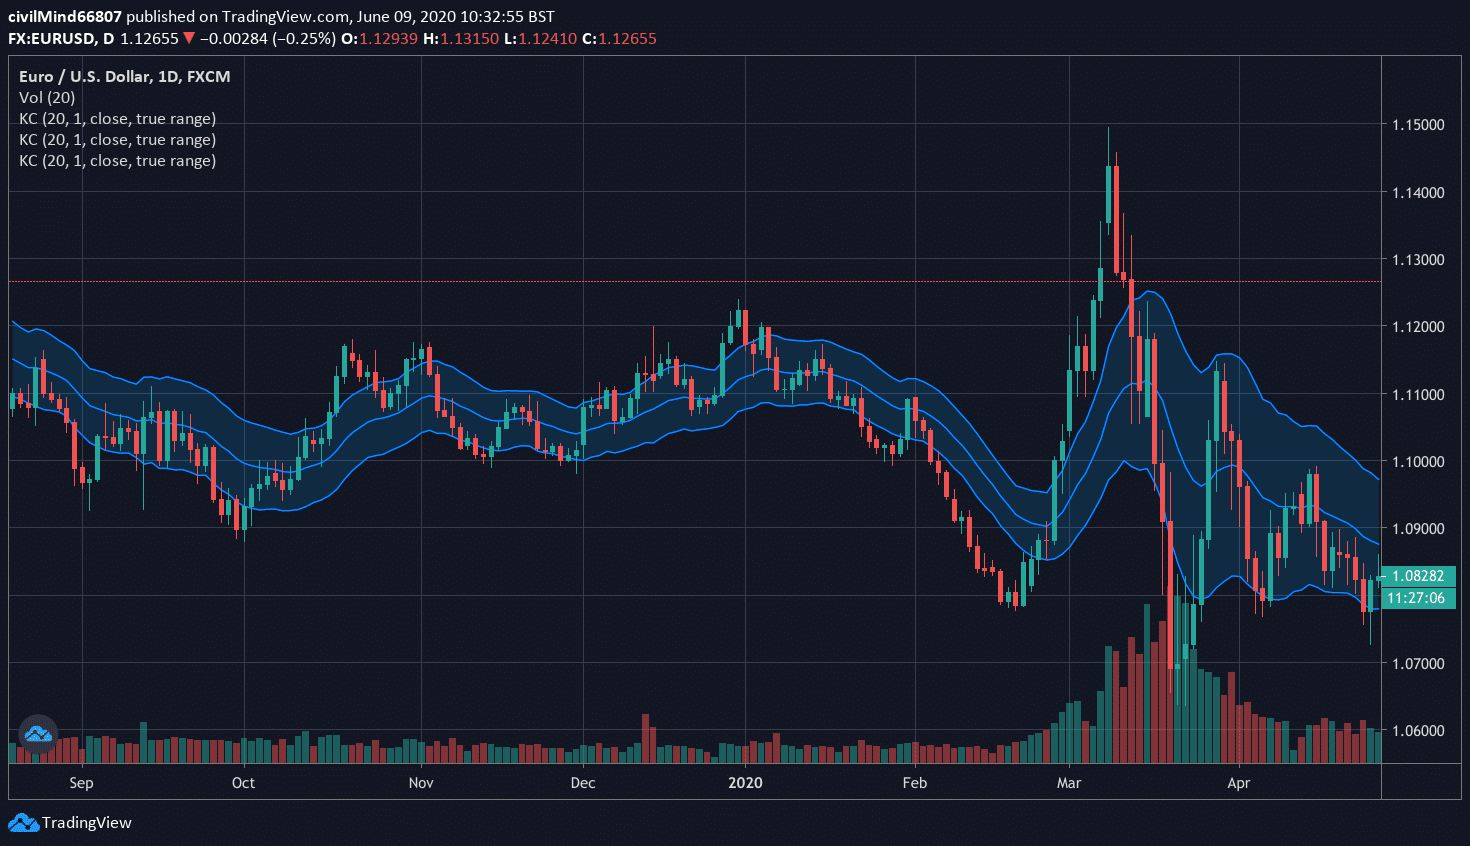
Based on volatility readings in various assets, the Keltner Channel will be composed of three individual lines representing specific price calculations.
- Center Line – plots an EMA of the market price of the asset
- Upper Line – plots a level that is 2x the ATR of the asset’s EMA
- Lower Line – plotted below price action, at a level that is -2x the ATR of the asset’s EMA.
Each of these lines will contract or expand on the price charts at rates that are based on changes in volatility generated by the ATR of the asset:
- Center Line = EMA of market prices (usually at least 20 market periods)
- Lower Line = EMA (center line) – 2 x ATR (usually at least 10 market periods)
- Upper Band= EMA (center line) + 2 x ATR (usually at least 10 market periods)
Not surprisingly, most of the market’s price action tends to be contained within the upper and lower boundaries of the Keltner Channel, and that is why this indicator is so useful for certain types of traders (i.e. swing traders looking to capitalize on contrarian reversals).
However, there will also be instances that are characterized by above average volatility levels, and this can send market prices outside of the envelope created by the Keltner Channel.
When this occurs, expert traders might interpret the indicator signals as either the acceleration of a price trend or the reversal of a price trend.
Additionally, traders will often observe the direction of the Keltner Channel itself as a way to determine likely trend direction in the future.
How To Use Keltner Channels
Keltner Channels can be used by traders in a wide variety of ways and the indicator can be customized in most market trading stations.
The indicator calculations that are associated with them are based on an asset’s current price level, as well as the generalized volatility level that is already present in the market.
Working in conjunction with one another, these important pieces of information can be used by traders to plot the Keltner Channel’s lower, middle, and upper lines through most financial charting platforms.
In practice, all three lines move in conjunction with the market price of an asset, and this activity creates a “channel” or “envelope” that allows traders to make predictions about possibilities of future price direction.
Most recent versions of this indicator will typically use a combination of the Average True Range (or ATR) and an Exponential Moving Average (or EMA) as the basis for its signals.
For these reasons, many expert traders will argue that this combined approach offers extra advantages when these strategies are compared to other forms of technical analysis.
A Keltner Channel period that includes a broader EMA (i.e more than 20 trading periods) will cause a greater “lag” in the readings generated by the indicator.
This means that the channels will not react as quickly to changes in the underlying market price.
To solve this problem, traders might select a shorter-term EMA so that the Keltner Channel responds more quickly to changes in the market price of an asset.
However, this will also result in greater difficulties in determining market trend direction and this is why traders must have strategic goals in mind whenever unique alterations are made to the Keltner Channel’s input calculations.
In the following price charts, we can see two opposing trading signals (both bullish and bearish) generated by the Keltner Channel that expert traders might use to establish live positions in the market.
How To See Keltner Channels
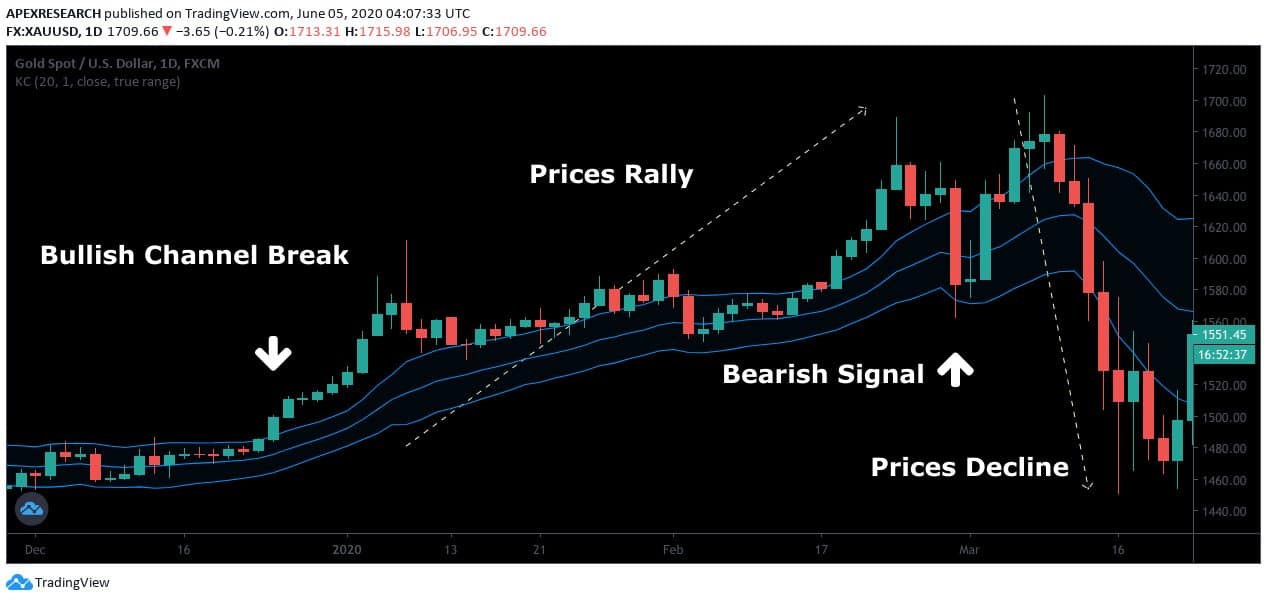
In the first chart example, prices begin to move above the Keltner Channel’s upper boundary, and this is a key indicator of bullish trend strength for the asset.
In addition to this bullush Keltner Channel break, we can also see that the indicator begins sloping in the upward direction.
This is another factor that suggests positive trend activity and this could inspire expert traders to establish bullish positions in the asset.
After prices rally, long traders should be looking for areas to begin taking profits and this occurs once prices fall back below the lower boundary of the Keltner Channel (bearish signal).
This would be a great time for long traders to take profits and exit their positions because price momentum is diminishing and prices quickly begin to decline after the bearish signal is revealed by the indicator.
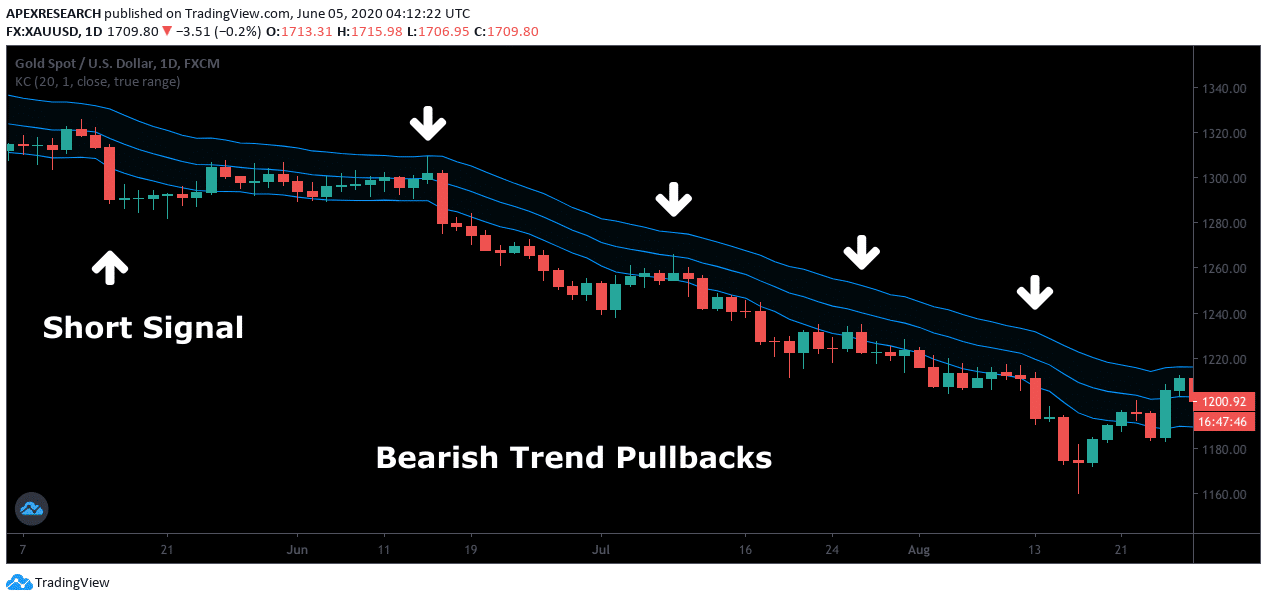
In the next historical chart example, we can see how the angle of the Keltner Channel might allow traders to identify the emergence of a bearish price trend.
As market prices fall below the lower boundary of the Keltner Channel, expert traders might begin to expect further trend weakness in the asset.
This information can be used to establish short positions which reflect a bearish view on the market.
In this example, we can see that prices consistently fail near the middle and upper boundaries of the Keltner Channel and this is a clear signal that bearish price pressures are dominating the market.
Traders might elect to establish short positions based on this information because the downside breakout suggests further declines are likely.
Short positions could be closed in the event that prices rise above the upper band of the Keltner Channel because this would suggest that the downtrend has ended and that an upward reversal might be ready to begin.
In these ways live positions can be established using the signals sent by the Keltner Channel and these are scenarios that can be applied to both bullish and bearish market environments.
Advantages
Common advantages related to the Keltner Channel will typically center around the indicator’s ability to identify market direction and potential price breakouts while new trends are still in their earliest stages.
In many cases, it can be difficult to spot the emergence of a new trend in asset prices, so the use of an objective market indicator such as the Keltner Channel can often be incredibly useful in automating this process.
The Keltner Channel can also aid in the placement of stop loss levels given the way the indicator can signal the end of a previous trend in market prices.
Disadvantages
As with any technical analysis indicator, the Keltner Channel also has its weaknesses. In this case, the Keltner Channel is considered to be a lagging indicator and this can make it difficult to assume previous trending moves in the market will continue in the future.
Fundamental events can also have a disruptive impact when economic data reports show unexpected changes in the market. Ultimately, these events can lead to losses if stop orders are triggered for individual trades.
Conclusion
In conclusion, the Keltner Channel often proves to be highly useful when traders are establishing a technical analysis strategy that can be used in active markets.
The Keltner Channel can also be used in conjunction with other technical indicators (such as the Relative Strength Index or Commodity Channel Index) as a way of creating a more comprehensive trading approach.
Things To Remember
- The Keltner Channel is a volatility indicator that can be used by traders to establish both bullish and bearish positions in the market.
- The Keltner Channel is usually based on a 20-period EMA and 10-period ATR but these levels can be adjusted to meet the needs of any individual trading style.
- When market prices are able to breach the upper band, the trading signal is bullish.
- When market prices fall below the Keltner Channel’s lower band, the trading signal is bearish.
- The trajectory of the Keltner Channel can also help traders to identify the market’s dominant trend direction. If the channel is pointed in the downward direction, the trading bias is bearish. If the channel is pointed in the upward direction, the trading bias is bullish.
- In a sideways trading environment, market prices might oscillate between the upper and lower bands. If this occurs, the Keltner Channel’s boundaries are generally expected to contain price action, with the lower band acting as support and the upper acting as resistance.


