What indicator outperforms traditional RSI across the board and has a favourable risk/reward ratio? Look no further than the Connors RSI indicator.
This indicator can be an invaluable tool for traders when applied correctly. Not only does it allow you to construct intra-day trading strategies with a high probability of success, it also reduces your potential for risk.
In this guide, we’re going to take a look at:
- What is Connors RSI?
- Why it is so successful
- Show you a real-life trading example
- How to calculate it
- Trading strategies for CRSI

What is Connors RSI?
The Connors RSI (CRSI) is an indicator used in technical analysis which was developed by Larry Connors. It is made up of of 3 individual components:
- Relative Strength Index (RSI)
- Up/Down Length (Market Streak Value)
- Rate of Change (ROC)
All of these components combine to create a momentum oscillator that can be used to make short-term trading decisions.
Connors RSI Strategy Example #1
The Connors RSI can be used to find both bullish and bearish trading opportunities in the market.
In our first example, we’re going to use a Bitcoin short trade as our example.
Chart signals indicate opportunities to sell Bitcoin at $8,080.90. Technical readings on the Connors RSI show overbought signals, which suggest prices are likely to move lower.
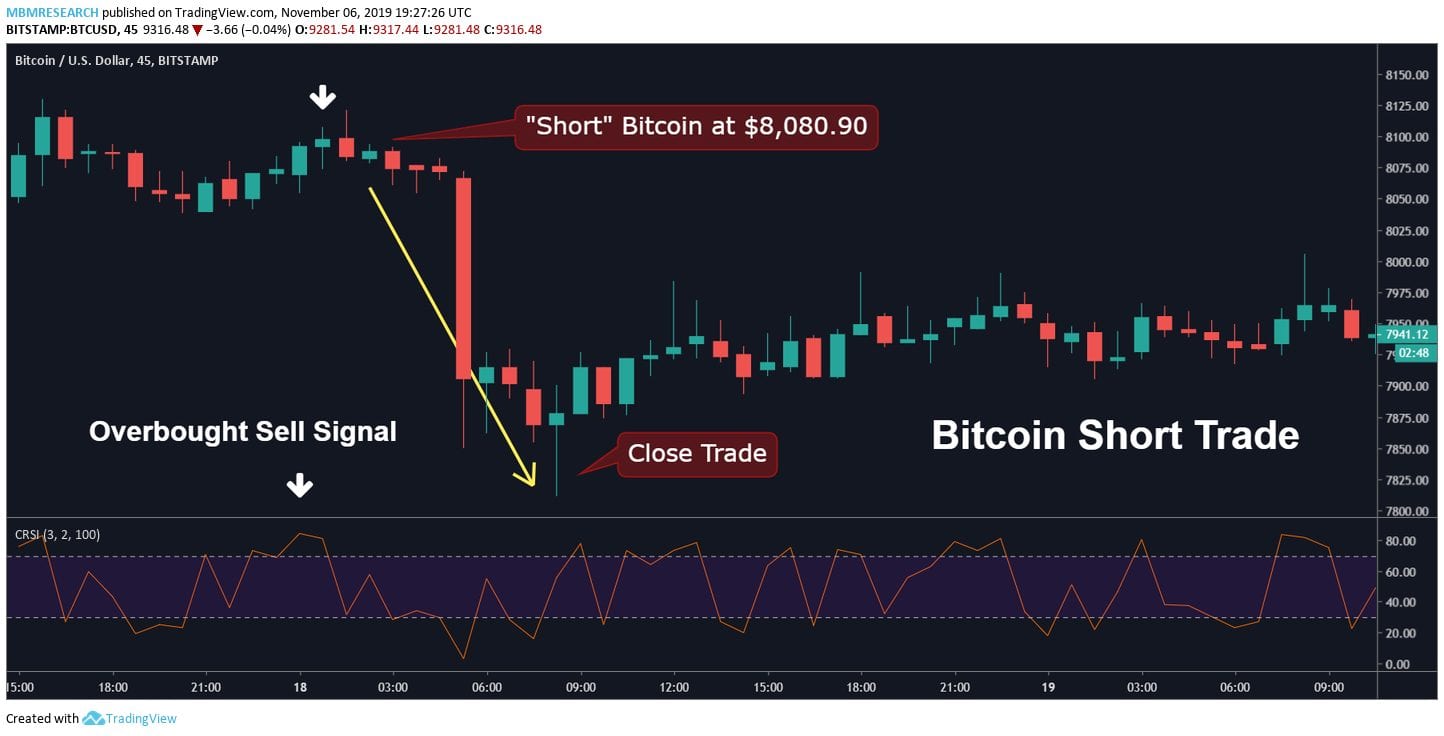
For the trade, stop loss levels can be set at the prior high of $8,120.50.
At the same time, profit target must reach $7,860.50 in order to give our trade a favorable risk-reward ratio.
Connors RSI Strategy Example #2
In our second chart example, we can see buy at $9,710.20 as a deeply oversold reading can be found in the Connors RSI.
This allows us to set a stop loss at $9,600.50 with a profit target of $10,350.10 while maintaining a favourable risk-reward ratio.
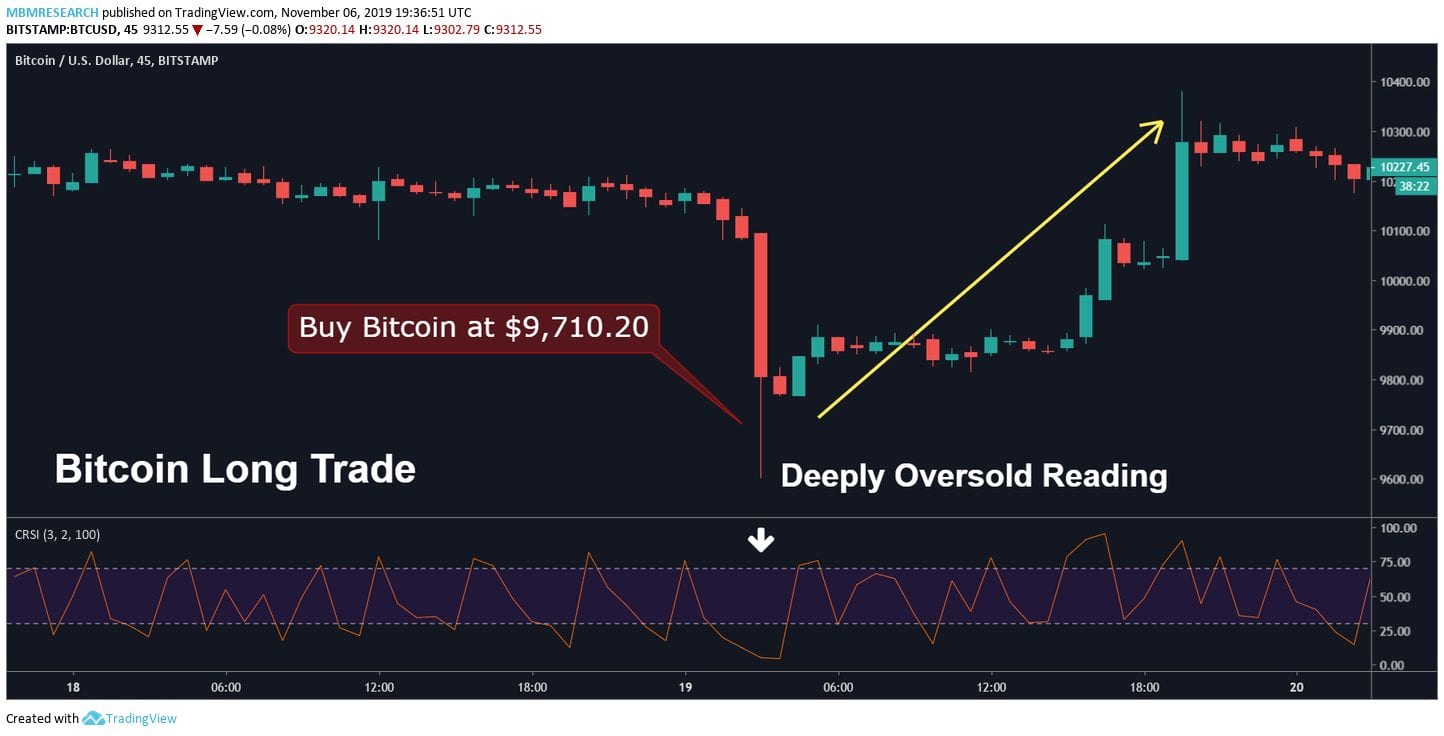
As a result, the Connors RSI can be a valuable tool which can be used to construct intra-day strategies with a high probability of success.
Trading signals are generated based on indicator readings that fall between the values of 0 and 100.
In general, indicator readings below 5 suggest asset prices are oversold (a buy signal), while indicator readings above 95 suggest asset prices are overbought (a sell signal).
However, user-defined calculations can be used to alter the default parameters on most of the market’s popular trading platforms.
Useful Pages:
Compare Stock Brokers | Compare Forex Brokers | Compare CFD Brokers
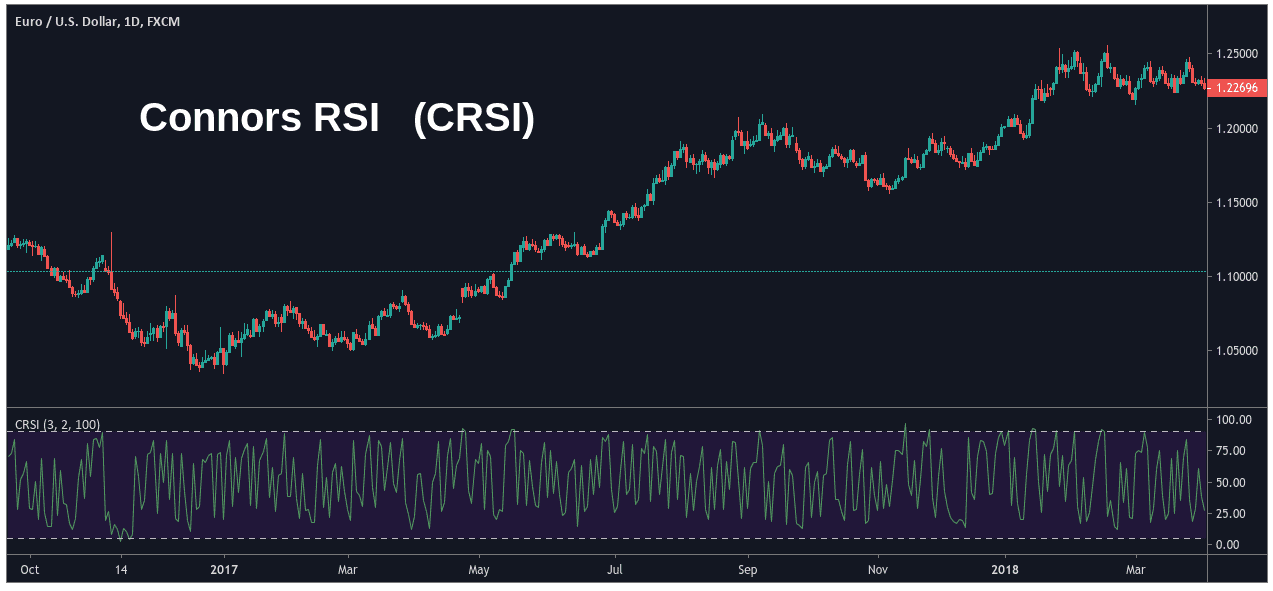
Connors RSI vs RSI
On the graphs below, you can see a visual comparison between the Connors RSI and traditional RSI:
Connors RSI Graph
Traditional RSI Graph
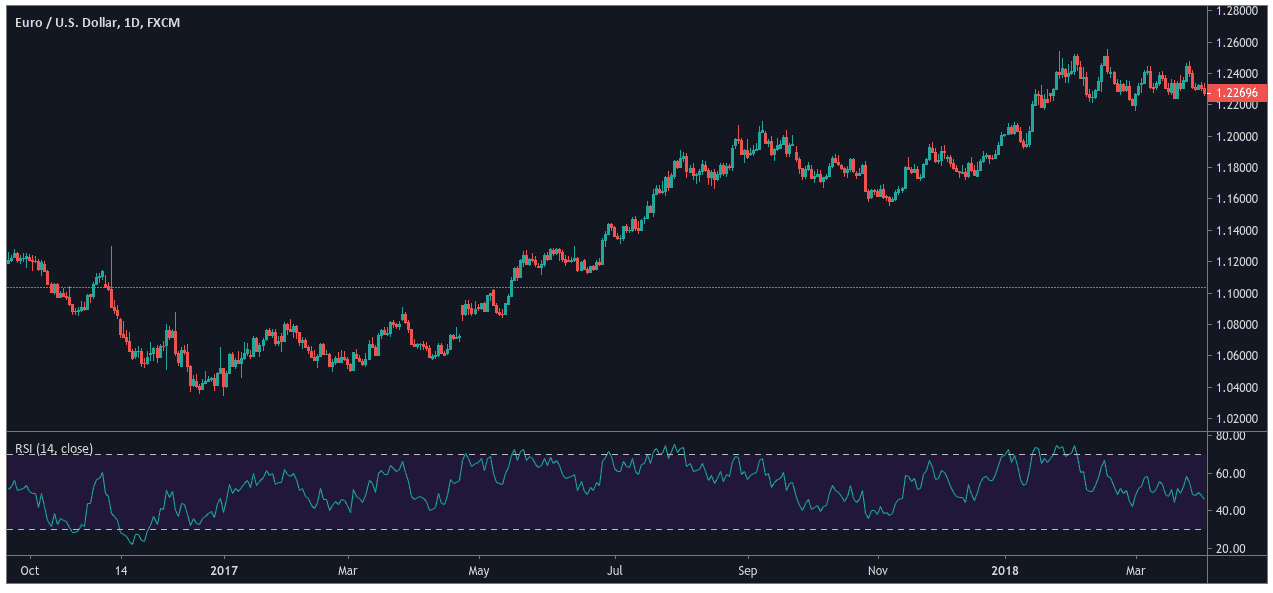
At first glance, we can see that the CRSI appears to give signals that are faster-moving and more volatile.
There is some truth to this assumption because the CRSI works based on inputs that focus on shorter-term price changes in the market.
However, it would be incorrect to assume that signals sent by the CRSI indicator might therefore be more erratic.
The truth is that historical backtesting results show that CRSI trading signals have a higher rate of success in the market.
Why Connors RSI Strategy is More Successful
Traditional RSI readings define an indicator mid-range of 30-70. Market activity below 30 implies oversold conditions (a buy signal) and above 70 implies overbought conditions (a sell signal).
The CRSI enhances this approach by stretching the mid-range to broader extremes, with readings below 5 indicating oversold conditions and above 95 indicating overbought conditions.
This deeper indicator range helps to:
- Reduce the number of false trading signals
- Limits the possibility of losses when sequential positions are initiated over time
Let’s take a closer look at how the CRSI indicator accomplishes this task of relative market outperformance when compared to its more traditional counterparts.

Connors RSI Formula
There 3 three main components you’ll need to calculate the values shown in the underlying Connors RSI readings:
1. Relative Strength Index
Plotted as a 3-period RSI (short-term indicator reading)
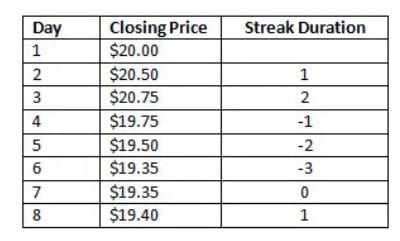
2. Up/Down Length
Consecutive chart intervals during which the price of an asset has closed up (higher than the previous time interval) or closed down (lower than the previous time interval)
Positive numbers are used to represent upward closing values and negative numbers are used to represent downward closing values.
If the asset closes at the same price (no change) during consecutive chart intervals, the Up/Down Length is 0.
The Connors RSI then takes a short-term RSI reading of the Up/Down streak value.
Typically, traders will plot this is as a 2-period RSI (which is another short-term indicator reading).
3. Rate of Change
ROC defines a backward-looking time period and uses its value to calculate a percentage of the number of intervals that are below the price change percentage of the current time interval.
Finally, the CRSI calculation finds the average value of all three indicator components:
CRSI (3, 2, 100) =
[ RSI (3 periods) + RSI Up/Down Length (2 periods) + ROC (100) ] / 3
Backtesting Results
The Connors RSI can be used when trading in any asset class such as stocks, crypto and forex.
However, historical backtesting results from the stock market show how readings in the indicator can predict future price movements:
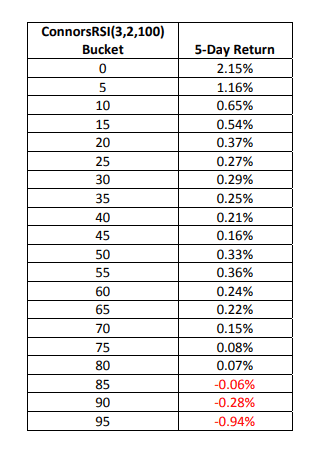
When the value of the Connors RSI falls below 20, we can see that the average market returns over the next five days start to increase substantially.
Stocks falling into the 0 bucket (with a CRSI indicator reading of 0 to 5) experienced average price gains of 2.15% during the following five trading sessions.
Inverse price behaviour occurred at the upper end of the CRSI indicator range (conditions with indicator readings above 80).
Stocks in this category experienced losses with declines in the 95 bucket averaging 0.94% during the next five trading sessions.
To get a visual sense of how these numbers are dispersed over the entire CRSI spectrum, consider the chart below:
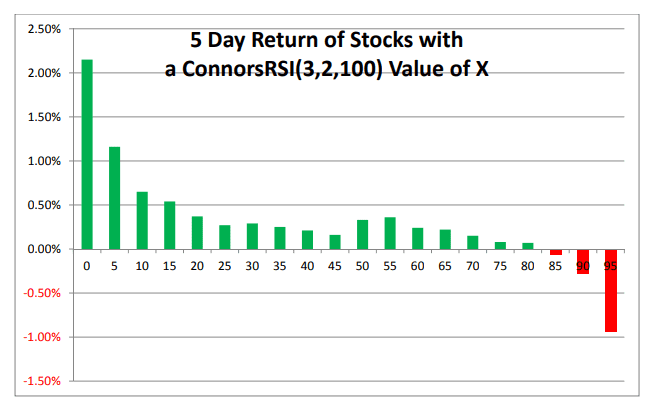
Essentially, this tells us that readings in the CRSI indicator can be highly adept at spotting potential reversals in the market.
Once price valuations reach relative extremes (with readings below 5 or above 95), trading signals are triggered which can be used to structure a short-term positioning stance in the market.

Connors RSI Trading Strategy
To understand the base trading signals that are sent by the Connors RSI, we can draw strategic lessons from the use of the traditional RSI indicator.
In practice, we can see that most of the same rules tend to apply as the basic indications present in “overbought” and “oversold” trading activity remain present.
However, there are differences in the number of signals that are sent and the strength (or intensity) of the readings that are generated by the indicator.
The central difference lies in the “overbought” and “oversold parameters themselves, which are extended to more extreme levels.
Ultimately, this means the CRSI indicator will send fewer trading signals when compared to the traditional RSI indicator.
However, these signals will also have a higher probability for accuracy in their respective predictive abilities.
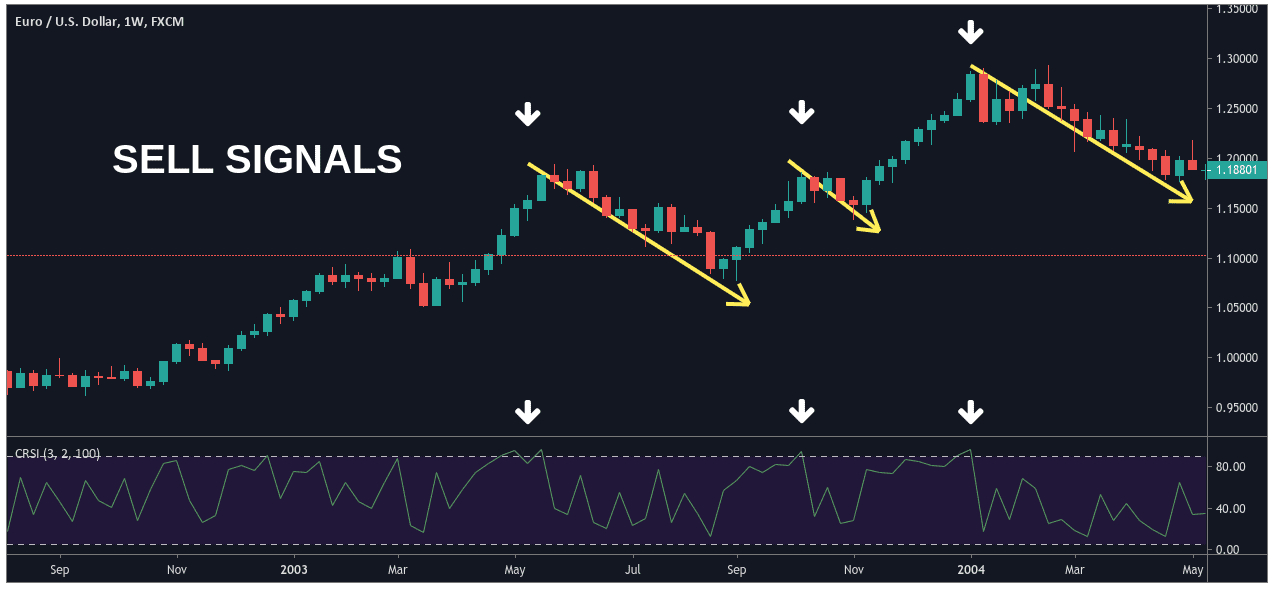
In the chart shown above, you can see a series of sell signals generated by the Connors RSI.
On three separate occasions, upward price rallies in the value of the asset cause the CRSI reading to move above the 95 level.
This suggests investors have become too optimistic and that markets are much more likely to begin reversing to the downside.
In each of these cases, the asset hit a swing high and then started to fall in line with the projections made by the CRSI.
We can also see that downside follow-through was most substantial in the first and third examples, while the follow-through in the second example was somewhat limited.
As a result, it is clear that traders should be relatively aggressive when moving their stop losses when using the CRSI indicator strategy.
This shouldn’t be surprising, given the short-term nature of its calculations.
As a general rule, traders should open positions with a fairly tight stop loss parameter (30-60 pips, depending on historical support/resistance levels present on your price chart).
Traders can then move their stop losses to the “break-even” point once the position is showing gains of at least 30 pips.
In cases where there is extended follow-through (i.e. bearish CRSI trading example numbers one and three), this approach will likely result in substantial profits on the position.
Trading examples with limited price follow-through (i.e. trading example number two) will likely result in the position being stopped out at the break-even point (no gains / no losses).
On balance, this shows that the CRSI offers highly accurate sell signals with limited potential for losses.
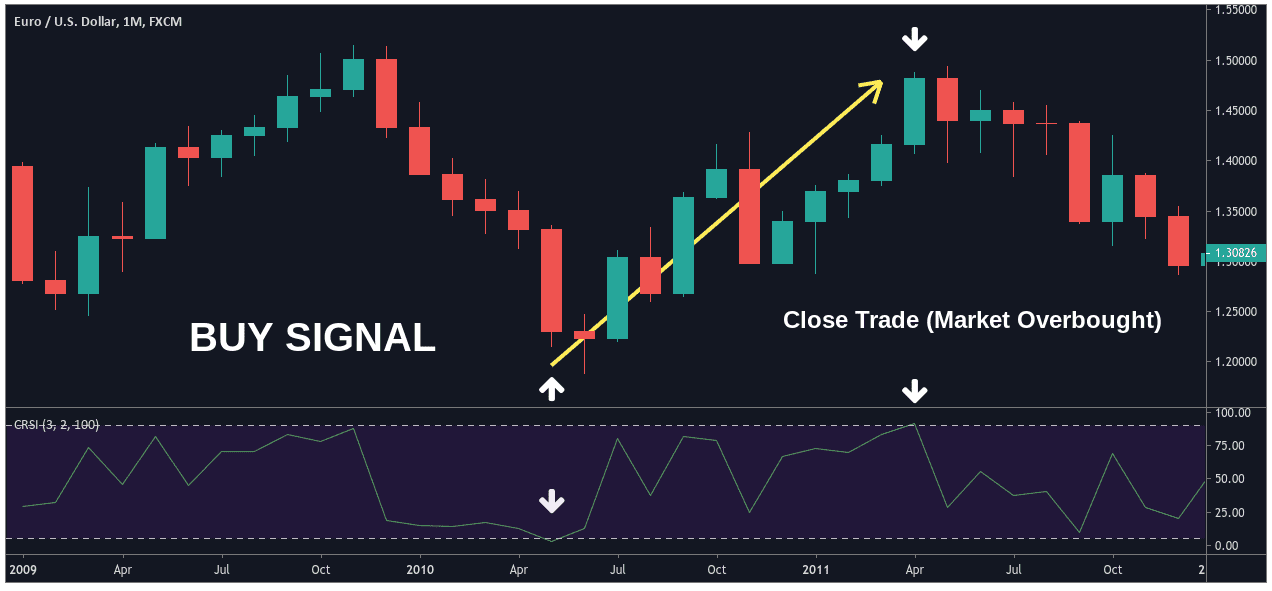
On the other side, we can see above that CRSI generates a buy signal as the indicator falls below the lower threshold level.
As the CRSI reading drops below 5, investors have likely become too pessimistic on the prospects for the asset and markets are likely ready for an upside reversal in prices.
Here, we can see that prices ultimately move in the direction projected by the CRSI (upward).
Traders could have soon moves stop losses to the break-even point and continued to carry the trade until the CRSI sent its next trading signal.
Eventually, this occurred as valuations forced a breach in the upper CRSI parameter (above the 95 level).
This alerts traders to overbought conditions and suggests it is a good time to close long positions (as markets are likely preparing for a reversal).
Using this strategy, traders could have captured significant gains while experiencing very little drawdown in the process.
Engage in the discussion
The Bottom Line
- Connors RSI (CRSI) is a momentum oscillator which employs the averages of three separate indicators in its calculations.
- The composite reading reflects the averages found in the Relative Strength Index (RSI), the Up/Down Length (market streak value), and Rate of Change (ROC).
- Readings above 95 indicate overbought conditions (sell signal) while readings below 5 indicate oversold conditions (buy signal).
- Trading strategies utilizing trailing stops can help traders to limit risk while maximizing the possibility of reward (profitability) in each trade.
- Backtesting results show that the CRSI blended indicator reading tends to outperform strategies using the traditional RSI indicator developed by J. Welles Wilder.
- Overall, the Connors RSI is a valuable tool that can be used to construct intra-day strategies with favourable risk/reward ratios and a high probability of success.