The banking landscape in the UK
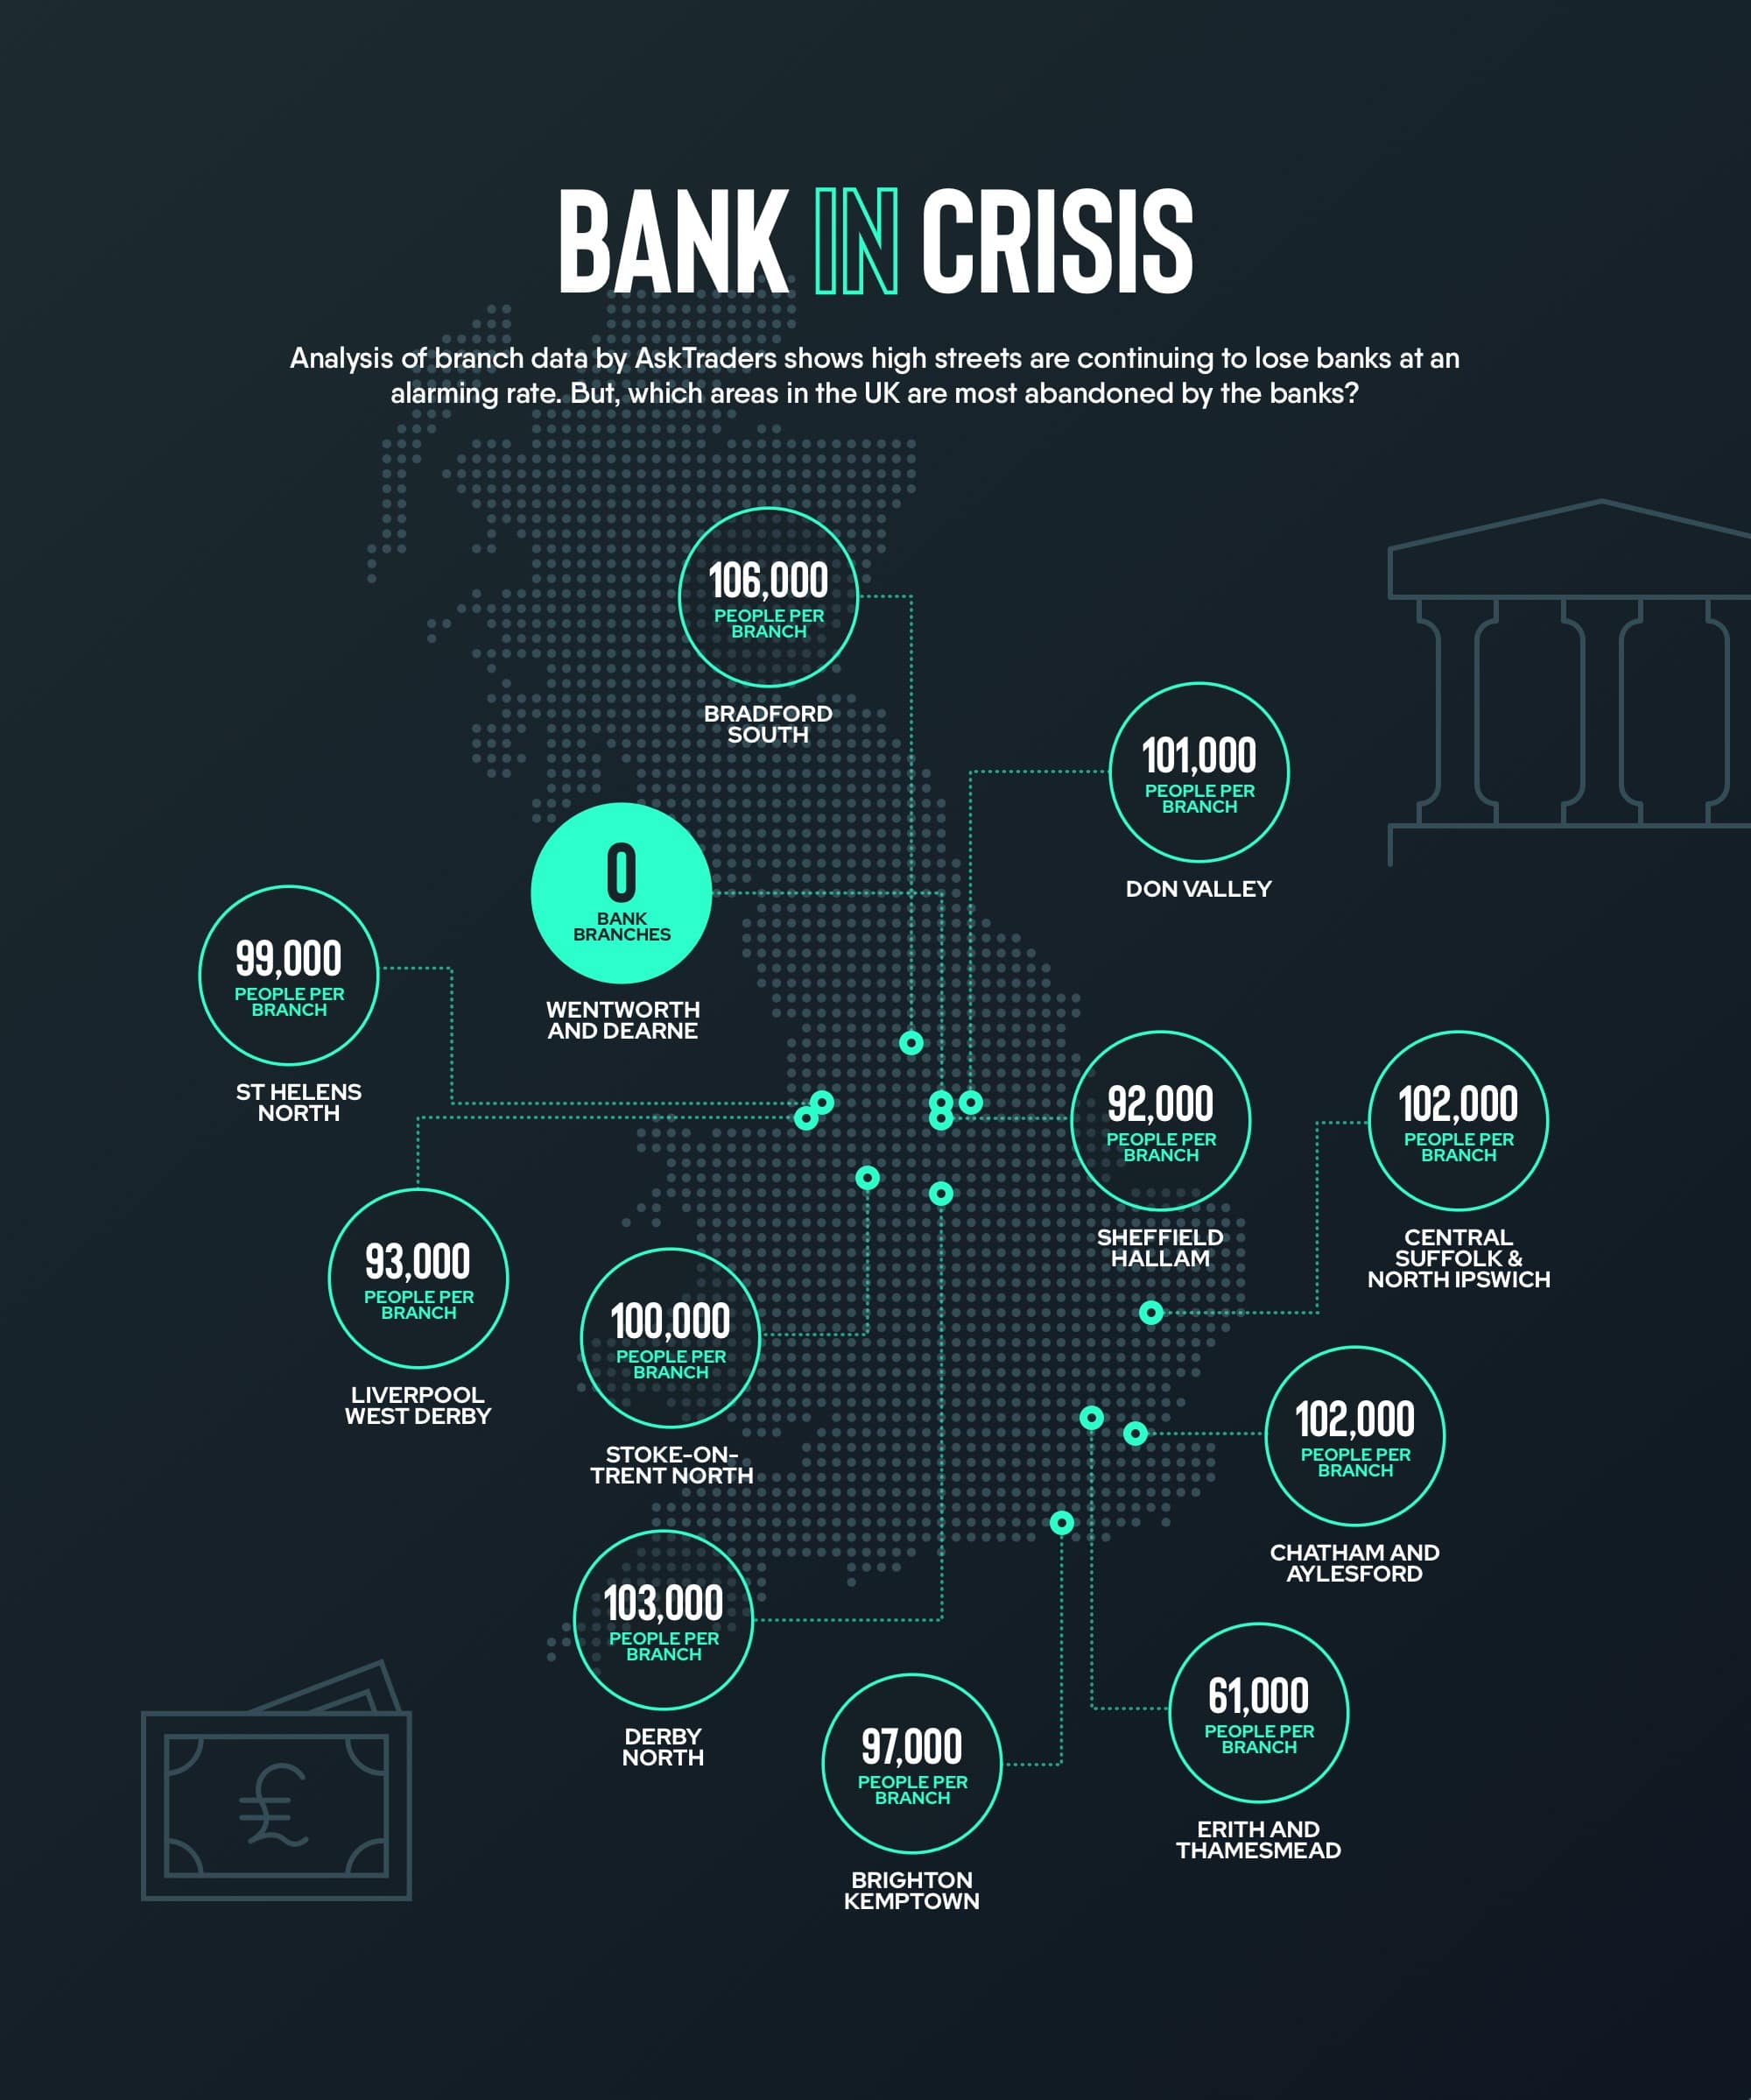
Last year, Wentworth and Dearne in Yorkshire became the first constituency to lose all of its banks, however, our study reveals several more places in the UK are being abandoned by the banks – a trend that shows no sign of stopping.
In fact, analysis of the latest bank branch data published by Which? reveals high street banks in the UK will be completely wiped by April 2032 should they continue to close at the current rate.
Since 2015, each constituency in the UK has lost an average of a third of its branches.
With an average of 55 closures each month for the past five years, we’ve looked into the constituencies worst hit by the bank closures.
The 12 areas in the UK with the fewest banks per capita
| Rank | Constituency | People per branch |
| 1 | Wentworth and Dearne | No bank branches |
| 2 | Bradford South | 106,000 |
| 3 | Derby North | 103,000 |
| 4 | Chatham and Aylesford | 102,000 |
| 5 | Central Suffolk and North Ipswich | 102,000 |
| 6 | Don Valley | 101,000 |
| 7 | Stoke-on-Trent North | 100,000 |
| 8 | St Helens North | 99,000 |
| 9 | Brighton Kemptown | 97,000 |
| 10 | Liverpool West Derby | 93,000 |
| 11 | Sheffield Hallam | 92,000 |
| 12 | Erith and Thamesmead | 61,000 |
With just one bank in the entire constituency, a solitary branch in Bradford South serves just less than 106,000 people while in Derby North and Chatham and Aylesford a single bank serves 102,509 and 102,240 people respectively. Only residents in Wentworth and Dearne have worse access to a bank than these three constituencies.
In contrast, residents in Na h-Eileanan an Iar, Scotland, have the best access to bank branches with 108 branches serving a population of 26,830. That equates to just 248 people per bank. Those living in Ross, Skye and Lochaber and Argyll and Bute also have banks in plentiful supply with 219 and 119 branches respectively.
Cities of London and Westminster is the English constituency with the best supply of banks in relation to its population. Just less than 130,000 people are served by 112 banks which works out at 1,160 people per bank.
The demand for high street banks
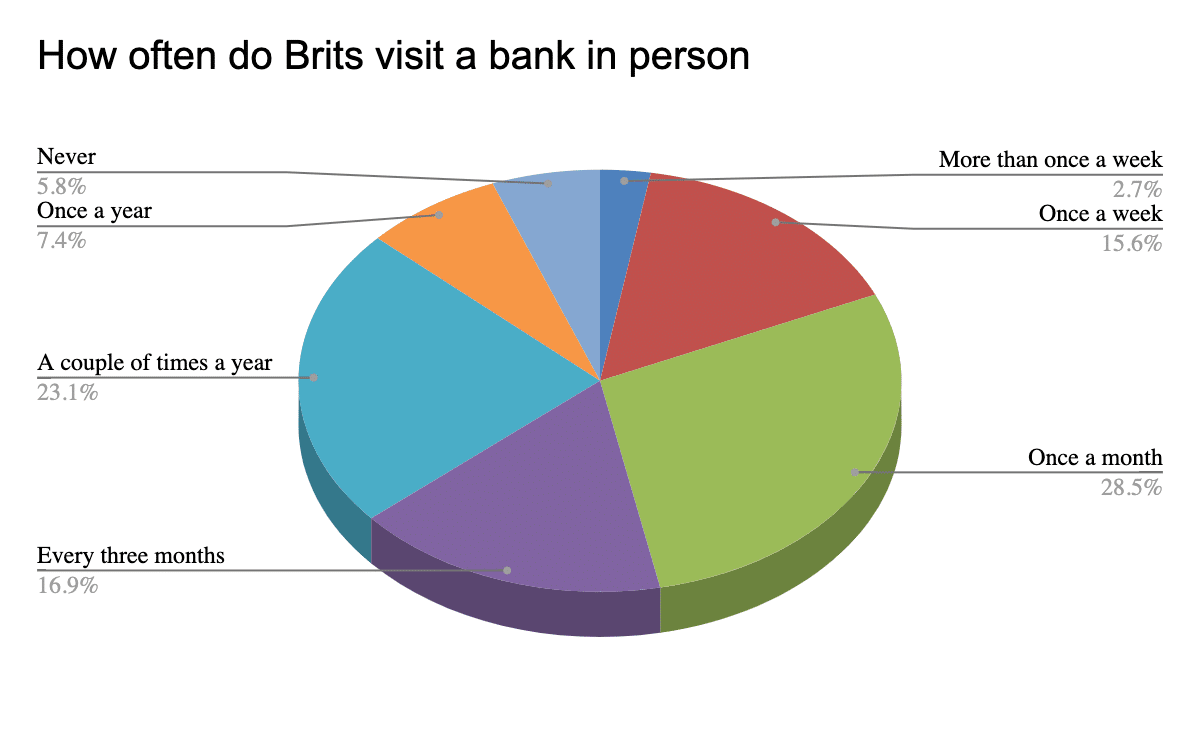
Despite access to banks becoming all the more restricted, our survey has revealed 19 per cent of people still visit a branch once a week or more while 29 percent of Brits said they visited a bank once a month. Just 6 per cent of people said they don’t go to a bank.
Why do people visit the bank?
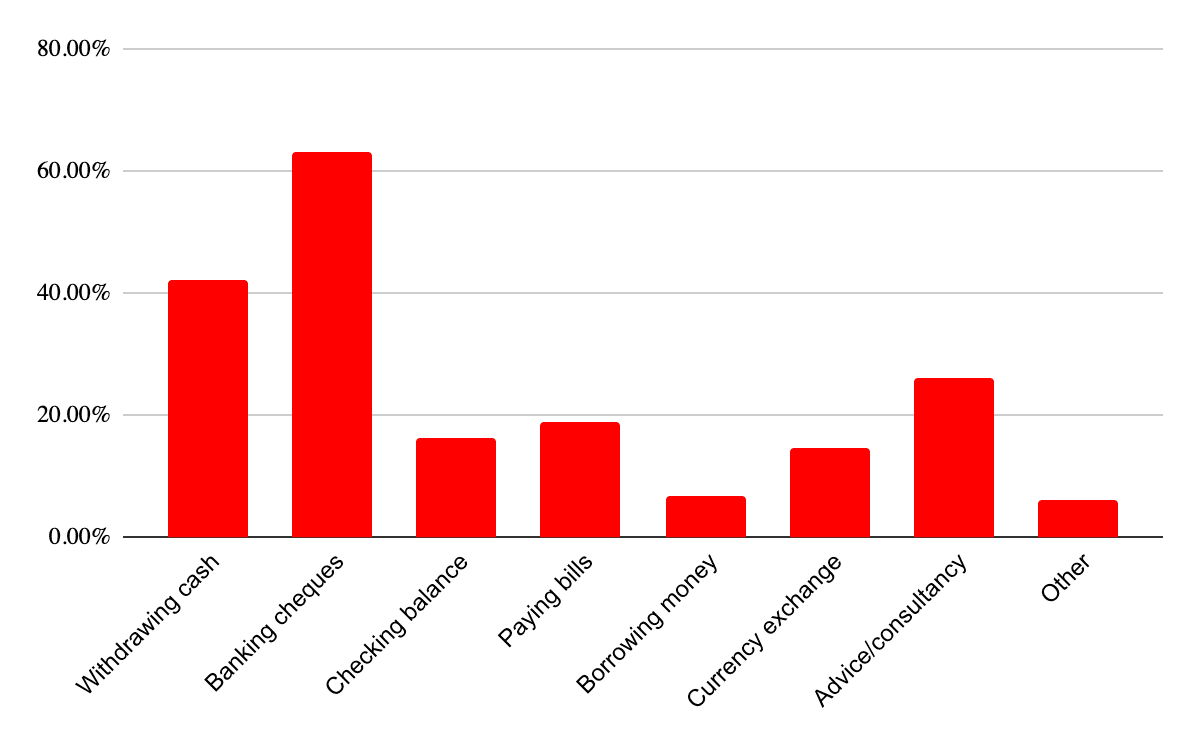
With more than a third of people visiting the bank as regularly as they did five years ago, what are the services most frequently used?
The most common reason for people visiting a bank is to pay-in cheques, followed by withdrawing cash and seeking financial advice. 20 per cent of people said they went to a branch to pay their bills.
| A | B | C | D | E | |
|---|---|---|---|---|---|
|
1
|
Constituency |
Branches Left
|
% network lost since Jan 2015
|
Population |
People per branch
|
|
2
|
Wentworth and Dearne | 0 | 100% | 99,150 | No branches |
|
3
|
Bradford South | 1 | 75% | 105,865 | 105865 |
|
4
|
Derby North | 1 | 80% | 102,509 | 102509 |
|
5
|
Chatham and Aylesford | 1 | 80% | 102,240 | 102240 |
|
6
|
Central Suffolk and North Ipswich | 1 | 50% | 101,907 | 101907 |
|
7
|
Don Valley | 1 | 88% | 100,577 | 100577 |
|
8
|
Stoke-on-Trent North | 1 | 86% | 99,615 | 99615 |
|
9
|
St Helens North | 1 | 67% | 99,320 | 99320 |
|
10
|
Brighton, Kemptown | 1 | 86% | 96,557 | 96557 |
|
11
|
Liverpool, West Derby | 1 | 50% | 93,177 | 93177 |
|
12
|
Sheffield, Hallam | 1 | 75% | 92,196 | 92196 |
|
13
|
Erith and Thamesmead | 2 | 50% | 121,867 | 60934 |
|
14
|
Manchester, Gorton | 2 | 71% | 119,184 | 59592 |
|
15
|
South Cambridgeshire | 2 | 50% | 116,766 | 58383 |
|
16
|
North Swindon | 2 | 60% | 112,981 | 56491 |
|
17
|
Oldham East and Saddleworth | 2 | 75% | 106,874 | 53437 |
|
18
|
Sherwood | 2 | 67% | 101,361 | 50681 |
|
19
|
Hemsworth | 2 | 67% | 99,246 | 49623 |
|
20
|
Barnsley East | 2 | 60% | 95,016 | 47508 |
|
21
|
Leeds West | 2 | 50% | 94,444 | 47222 |
|
22
|
North East Derbyshire | 2 | 75% | 91,877 | 45939 |
|
23
|
Penistone and Stocksbridge | 2 | 75% | 89,545 | 44773 |
|
24
|
North West Cambridgeshire | 3 | 57% | 134,261 | 44754 |
|
25
|
Houghton and Sunderland South | 2 | 33% | 87,921 | 43961 |
|
26
|
Jarrow | 2 | 33% | 83,483 | 41742 |
|
27
|
Newport East | 2 | 67% | 81,901 | 40951 |
|
28
|
Bradford East | 3 | 63% | 119,261 | 39754 |
|
29
|
Coventry North West | 3 | 40% | 113,468 | 37823 |
|
30
|
Mid Bedfordshire | 3 | 40% | 112,185 | 37395 |
|
31
|
Colne Valley | 3 | 50% | 111,919 | 37306 |
|
32
|
Birmingham, Selly Oak | 3 | 57% | 110,024 | 36675 |
|
33
|
Mitcham and Morden | 3 | 50% | 106,412 | 35471 |
|
34
|
Wirral West | 2 | 75% | 69,634 | 34817 |
|
35
|
Newcastle upon Tyne East | 3 | 57% | 102,715 | 34238 |
|
36
|
South Basildon and East Thurrock | 3 | 40% | 101,390 | 33797 |
|
37
|
Bristol East | 3 | 63% | 101,133 | 33711 |
|
38
|
Luton North | 3 | 40% | 100,602 | 33534 |
|
39
|
Makerfield | 3 | 57% | 100,449 | 33483 |
|
40
|
Walsall North | 3 | 50% | 100,050 | 33350 |
|
41
|
South Staffordshire | 3 | 63% | 97,406 | 32469 |
|
42
|
Warrington North | 3 | 40% | 96,930 | 32310 |
|
43
|
York Outer | 3 | 57% | 96,741 | 32247 |
|
44
|
Wolverhampton South East | 3 | 40% | 94,358 | 31453 |
|
45
|
Plymouth, Moor View | 3 | 40% | 93,697 | 31232 |
|
46
|
Blackley and Broughton | 4 | 50% | 122,538 | 30635 |
|
47
|
South Northamptonshire | 4 | 50% | 118,875 | 29719 |
|
48
|
North East Bedfordshire | 4 | 50% | 116,917 | 29229 |
|
49
|
Denton and Reddish | 3 | 57% | 86,935 | 28978 |
|
50
|
Glasgow North East | 3 | 63% | 86,655 | 28885 |
|
51
|
Sheffield, Brightside and Hillsborough | 4 | 50% | 112,812 | 28203 |
|
52
|
Sedgefield | 3 | 63% | 84,523 | 28174 |
|
53
|
Dagenham and Rainham | 4 | 43% | 112,410 | 28103 |
|
54
|
Nottingham East | 4 | 43% | 110,461 | 27615 |
|
55
|
Harrow East | 4 | 67% | 108,539 | 27135 |
|
56
|
Westminster North | 5 | 67% | 134,137 | 26827 |
|
57
|
Stockton South | 4 | 50% | 104,381 | 26095 |
|
58
|
Reading West | 4 | 60% | 104,145 | 26036 |
|
59
|
Birmingham, Hodge Hill | 5 | 17% | 129,538 | 25908 |
|
60
|
Bolsover | 4 | 33% | 99,175 | 24794 |
|
61
|
Kingston upon Hull North | 4 | 43% | 98,400 | 24600 |
|
62
|
Ealing North | 5 | 50% | 120,493 | 24099 |
|
63
|
Bolton West | 4 | 69% | 95,976 | 23994 |
|
64
|
Belfast East | 4 | 60% | 95,752 | 23938 |
|
65
|
Sheffield, Heeley | 4 | 43% | 95,132 | 23783 |
|
66
|
Tottenham | 6 | 25% | 142,008 | 23668 |
|
67
|
Middlesbrough South and East Cleveland | 4 | 50% | 93,890 | 23473 |
|
68
|
Cardiff South and Penarth | 5 | 55% | 116,462 | 23292 |
|
69
|
Lewisham West and Penge | 5 | 50% | 115,741 | 23148 |
|
70
|
Romsey and Southampton North | 4 | 33% | 91,558 | 22890 |
|
71
|
Hackney South and Shoreditch | 6 | 14% | 136,783 | 22797 |
|
72
|
Haltemprice and Howden | 4 | 67% | 89,782 | 22446 |
|
73
|
Batley and Spen | 5 | 69% | 111,704 | 22341 |
|
74
|
Leicester West | 5 | 44% | 109,214 | 21843 |
|
75
|
Heywood and Middleton | 5 | 62% | 107,269 | 21454 |
|
76
|
Edinburgh East | 5 | 72% | 107,182 | 21436 |
|
77
|
South Leicestershire | 5 | 55% | 106,924 | 21385 |
|
78
|
Bristol North West | 5 | 50% | 106,446 | 21289 |
|
79
|
Mid Derbyshire | 4 | 64% | 84,333 | 21083 |
|
80
|
South Derbyshire | 5 | 17% | 104,493 | 20899 |
|
81
|
Swansea East | 4 | 33% | 83,534 | 20884 |
|
82
|
Charnwood | 5 | 55% | 103,006 | 20601 |
|
83
|
East Worthing and Shoreham | 5 | 67% | 101,876 | 20375 |
|
84
|
Bury South | 5 | 55% | 100,300 | 20060 |
|
85
|
Hazel Grove | 4 | 64% | 80,218 | 20055 |
|
86
|
Falkirk | 8 | 47% | 160,340 | 20043 |
|
87
|
Garston and Halewood | 5 | 44% | 99,596 | 19919 |
|
88
|
Doncaster North | 5 | 29% | 99,232 | 19846 |
|
89
|
Sleaford and North Hykeham | 6 | 33% | 118,604 | 19767 |
|
90
|
Rother Valley | 5 | 55% | 97,018 | 19404 |
|
91
|
Dulwich and West Norwood | 6 | 45% | 116,392 | 19399 |
|
92
|
West Bromwich West | 5 | 38% | 96,226 | 19245 |
|
93
|
Bristol South | 6 | 50% | 113,670 | 18945 |
|
94
|
Stalybridge and Hyde | 5 | 58% | 94,678 | 18936 |
|
95
|
Meriden | 6 | 54% | 112,560 | 18760 |
|
96
|
Birmingham, Perry Barr | 6 | 33% | 112,444 | 18741 |
|
97
|
Brent Central | 8 | 38% | 149,140 | 18643 |
|
98
|
Southend West | 5 | 50% | 92,792 | 18558 |
|
99
|
Lewisham East | 6 | 0% | 110,912 | 18485 |
|
100
|
Liverpool, Walton | 5 | 38% | 92,084 | 18417 |
|
101
|
Forest of Dean | 5 | 44% | 90,903 | 18181 |
|
102
|
Eddisbury | 5 | 29% | 90,854 | 18171 |
|
103
|
East Antrim | 5 | 29% | 90,296 | 18059 |
|
104
|
Stoke-on-Trent South | 5 | 38% | 89,881 | 17976 |
|
105
|
Norwich North | 5 | 17% | 89,565 | 17913 |
|
106
|
Hackney North and Stoke Newington | 8 | 50% | 142,882 | 17860 |
|
107
|
Knowsley | 6 | 33% | 106,630 | 17772 |
|
108
|
Buckingham | 6 | 40% | 106,292 | 17715 |
|
109
|
Glasgow North West | 5 | 44% | 87,964 | 17593 |
|
110
|
Barking | 8 | 27% | 140,733 | 17592 |
|
111
|
North Tyneside | 6 | 45% | 105,447 | 17575 |
|
112
|
Rhondda | 4 | 67% | 69,537 | 17384 |
|
113
|
South East Cambridgeshire | 7 | 46% | 121,054 | 17293 |
|
114
|
Worsley and Eccles South | 6 | 25% | 103,706 | 17284 |
|
115
|
Filton and Bradley Stoke | 6 | 45% | 103,575 | 17263 |
|
116
|
Leeds North West | 5 | 71% | 86,170 | 17234 |
|
117
|
Edmonton | 7 | 13% | 120,343 | 17192 |
|
118
|
Selby and Ainsty | 6 | 54% | 102,725 | 17121 |
|
119
|
Feltham and Heston | 8 | 33% | 134,948 | 16869 |
|
120
|
Daventry | 6 | 14% | 101,156 | 16859 |
|
121
|
Islington North | 7 | 13% | 117,709 | 16816 |
|
122
|
Poplar and Limehouse | 10 | 29% | 167,368 | 16737 |
|
123
|
Ribble Valley | 6 | 54% | 100,348 | 16725 |
|
124
|
Nottingham North | 6 | 25% | 100,242 | 16707 |
|
125
|
Rushcliffe | 6 | 33% | 100,046 | 16674 |
|
126
|
South Ribble | 6 | 54% | 99,551 | 16592 |
|
127
|
Bolton North East | 6 | 40% | 98,389 | 16398 |
|
128
|
East Ham | 10 | 9% | 163,730 | 16373 |
|
129
|
Lichfield | 6 | 40% | 96,439 | 16073 |
|
130
|
Shipley | 6 | 50% | 95,797 | 15966 |
|
131
|
Coventry North East | 8 | 33% | 127,405 | 15926 |
|
132
|
North Wiltshire | 6 | 50% | 94,944 | 15824 |
|
133
|
Leyton and Wanstead | 7 | 36% | 110,744 | 15821 |
|
134
|
Glasgow East | 6 | 25% | 94,547 | 15758 |
|
135
|
North West Durham | 6 | 40% | 94,481 | 15747 |
|
136
|
Enfield North | 7 | 36% | 110,213 | 15745 |
|
137
|
North Warwickshire | 6 | 57% | 93,332 | 15555 |
|
138
|
Streatham | 8 | 11% | 124,358 | 15545 |
|
139
|
Aldridge-Brownhills | 5 | 17% | 77,476 | 15495 |
|
140
|
Newcastle upon Tyne North | 6 | 0% | 92,848 | 15475 |
|
141
|
Leeds North East | 6 | 40% | 92,566 | 15428 |
|
142
|
Paisley and Renfrewshire North | 6 | 57% | 92,525 | 15421 |
|
143
|
Witham | 6 | 25% | 92,372 | 15395 |
|
144
|
Corby | 8 | 27% | 123,010 | 15376 |
|
145
|
Ashfield | 7 | 53% | 107,100 | 15300 |
|
146
|
Wolverhampton North East | 6 | 25% | 91,732 | 15289 |
|
147
|
Maidenhead | 7 | 36% | 106,731 | 15247 |
|
148
|
Hemel Hempstead | 7 | 36% | 106,711 | 15244 |
|
149
|
Gravesham | 7 | 13% | 106,385 | 15198 |
|
150
|
Leigh | 7 | 46% | 105,408 | 15058 |
|
151
|
Wallasey | 6 | 33% | 90,194 | 15032 |
|
152
|
Birmingham, Hall Green | 8 | 33% | 120,133 | 15017 |
|
153
|
Calder Valley | 7 | 59% | 104,849 | 14978 |
|
154
|
Mid Ulster | 7 | 46% | 104,258 | 14894 |
|
155
|
Walthamstow | 8 | 11% | 118,891 | 14861 |
|
156
|
Birmingham, Northfield | 7 | 36% | 103,918 | 14845 |
|
157
|
Chorley | 7 | 36% | 103,800 | 14829 |
|
158
|
South Antrim | 7 | 46% | 103,550 | 14793 |
|
159
|
Croydon South | 8 | 50% | 117,598 | 14700 |
|
160
|
Glasgow South West | 6 | 40% | 87,784 | 14631 |
|
161
|
Croydon North | 10 | 33% | 146,238 | 14624 |
|
162
|
Leicester East | 8 | 27% | 116,608 | 14576 |
|
163
|
Kettering | 7 | 30% | 101,266 | 14467 |
|
164
|
Leeds East | 7 | 30% | 101,144 | 14449 |
|
165
|
Coatbridge, Chryston and Bellshill | 5 | 50% | 72,162 | 14432 |
|
166
|
Tynemouth | 7 | 22% | 100,538 | 14363 |
|
167
|
Basingstoke | 8 | 43% | 114,883 | 14360 |
|
168
|
Alyn and Deeside | 6 | 57% | 85,746 | 14291 |
|
169
|
Dewsbury | 8 | 20% | 114,113 | 14264 |
|
170
|
Gosport | 7 | 30% | 99,604 | 14229 |
|
171
|
Saffron Walden | 8 | 27% | 113,603 | 14200 |
|
172
|
Warley | 7 | 36% | 98,834 | 14119 |
|
173
|
Richmond Park | 9 | 40% | 126,904 | 14100 |
|
174
|
East Renfrewshire | 8 | 53% | 112,769 | 14096 |
|
175
|
Ealing, Southall | 7 | 36% | 98,504 | 14072 |
|
176
|
Rossendale and Darwen | 7 | 50% | 98,387 | 14055 |
|
177
|
Lewisham, Deptford | 9 | 18% | 126,489 | 14054 |
|
178
|
Broxtowe | 7 | 22% | 98,046 | 14007 |
|
179
|
Halton | 7 | 30% | 98,031 | 14004 |
|
180
|
Gateshead | 7 | 50% | 97,516 | 13931 |
|
181
|
Wokingham | 8 | 27% | 111,426 | 13928 |
|
182
|
Blackpool North and Cleveleys | 6 | 54% | 83,162 | 13860 |
|
183
|
Epsom and Ewell | 8 | 27% | 110,540 | 13818 |
|
184
|
Easington | 6 | 40% | 82,633 | 13772 |
|
185
|
Harwich and North Essex | 7 | 50% | 96,401 | 13772 |
|
186
|
The Wrekin | 7 | 59% | 96,325 | 13761 |
|
187
|
Vauxhall | 9 | 25% | 123,808 | 13756 |
|
188
|
Surrey Heath | 8 | 38% | 109,011 | 13626 |
|
189
|
Mansfield | 8 | 43% | 108,841 | 13605 |
|
190
|
Milton Keynes South | 10 | 29% | 135,909 | 13591 |
|
191
|
Eltham | 7 | 0% | 94,925 | 13561 |
|
192
|
Wythenshawe and Sale East | 8 | 27% | 108,227 | 13528 |
|
193
|
Oldham West and Royton | 8 | 43% | 108,193 | 13524 |
|
194
|
Woking | 8 | 50% | 108,034 | 13504 |
|
195
|
West Ham | 14 | 22% | 188,275 | 13448 |
|
196
|
Cardiff West | 7 | 30% | 93,481 | 13354 |
|
197
|
Tonbridge and Malling | 8 | 33% | 106,769 | 13346 |
|
198
|
Greenwich and Woolwich | 10 | 17% | 132,604 | 13260 |
|
199
|
Hyndburn | 7 | 53% | 92,808 | 13258 |
|
200
|
Ilford South | 11 | 31% | 145,537 | 13231 |
|
201
|
Chipping Barnet | 9 | 25% | 118,779 | 13198 |
|
202
|
Twickenham | 9 | 47% | 118,178 | 13131 |
|
203
|
Staffordshire Moorlands | 6 | 33% | 78,744 | 13124 |
|
204
|
Pendle | 7 | 56% | 91,405 | 13058 |
|
205
|
Edinburgh South | 7 | 53% | 91,318 | 13045 |
|
206
|
Thurrock | 10 | 23% | 129,896 | 12990 |
|
207
|
Hove | 8 | 38% | 103,793 | 12974 |
|
208
|
Rutherglen and Hamilton West | 6 | 54% | 77,568 | 12928 |
|
209
|
Castle Point | 7 | 46% | 90,070 | 12867 |
|
210
|
Kingston upon Hull East | 7 | 22% | 90,062 | 12866 |
|
211
|
Hayes and Harlington | 10 | 23% | 127,412 | 12741 |
|
212
|
Altrincham and Sale West | 8 | 56% | 101,861 | 12733 |
|
213
|
North East Hampshire | 8 | 38% | 101,362 | 12670 |
|
214
|
Glasgow South | 7 | 42% | 88,624 | 12661 |
|
215
|
Stretford and Urmston | 8 | 50% | 101,246 | 12656 |
|
216
|
Carshalton and Wallington | 6 | 14% | 75,928 | 12655 |
|
217
|
Braintree | 8 | 20% | 100,884 | 12611 |
|
218
|
Birmingham, Yardley | 9 | 36% | 113,280 | 12587 |
|
219
|
Edinburgh West | 8 | 53% | 100,471 | 12559 |
|
220
|
Washington and Sunderland West | 7 | 13% | 87,801 | 12543 |
|
221
|
Rochdale | 9 | 18% | 112,732 | 12526 |
|
222
|
Southampton, Test | 9 | 53% | 112,676 | 12520 |
|
223
|
Elmet and Rothwell | 8 | 20% | 100,122 | 12515 |
|
224
|
Redcar | 7 | 36% | 87,448 | 12493 |
|
225
|
Portsmouth North | 8 | 43% | 99,704 | 12463 |
|
226
|
Bootle | 8 | 38% | 99,639 | 12455 |
|
227
|
Airdrie and Shotts | 7 | 30% | 86,736 | 12391 |
|
228
|
Aylesbury | 10 | 38% | 123,732 | 12373 |
|
229
|
South West Hertfordshire | 9 | 50% | 110,640 | 12293 |
|
230
|
Stone | 7 | 50% | 86,018 | 12288 |
|
231
|
Ilford North | 9 | 10% | 110,544 | 12283 |
|
232
|
Stevenage | 8 | 27% | 98,203 | 12275 |
|
233
|
Fylde | 7 | 65% | 85,748 | 12250 |
|
234
|
West Lancashire | 8 | 38% | 97,655 | 12207 |
|
235
|
Bermondsey and Old Southwark | 12 | 33% | 146,406 | 12201 |
|
236
|
South Norfolk | 9 | 25% | 109,795 | 12199 |
|
237
|
Tooting | 9 | 0% | 109,595 | 12177 |
|
238
|
Harlow | 8 | 11% | 97,148 | 12144 |
|
239
|
Loughborough | 9 | 18% | 109,106 | 12123 |
|
240
|
Brentwood and Ongar | 8 | 43% | 96,515 | 12064 |
|
241
|
Kenilworth and Southam | 7 | 30% | 84,290 | 12041 |
|
242
|
Salford and Eccles | 10 | 55% | 119,854 | 11985 |
|
243
|
Shrewsbury and Atcham | 9 | 40% | 107,635 | 11959 |
|
244
|
Linlithgow and East Falkirk | 8 | 53% | 95,663 | 11958 |
|
245
|
Tamworth | 8 | 20% | 95,529 | 11941 |
|
246
|
Taunton Deane | 10 | 38% | 118,979 | 11898 |
|
247
|
Bournemouth East | 9 | 36% | 107,023 | 11891 |
|
248
|
Bradford West | 10 | 33% | 118,764 | 11876 |
|
249
|
Cleethorpes | 8 | 47% | 94,385 | 11798 |
|
250
|
Edinburgh South West | 9 | 47% | 106,047 | 11783 |
|
251
|
Midlothian | 14 | 26% | 164,876 | 11777 |
|
252
|
West Bromwich East | 8 | 0% | 93,802 | 11725 |
|
253
|
New Forest East | 8 | 47% | 93,614 | 11702 |
|
254
|
Newark | 9 | 44% | 104,876 | 11653 |
|
255
|
Blaenau Gwent | 6 | 54% | 69,713 | 11619 |
|
256
|
Bethnal Green and Bow | 13 | 13% | 150,337 | 11564 |
|
257
|
Southport | 8 | 47% | 92,356 | 11545 |
|
258
|
Rotherham | 8 | 11% | 91,889 | 11486 |
|
259
|
Maldon | 8 | 33% | 91,873 | 11484 |
|
260
|
Rugby | 9 | 18% | 103,354 | 11484 |
|
261
|
Kingswood | 8 | 38% | 91,691 | 11461 |
|
262
|
North Somerset | 9 | 47% | 102,194 | 11355 |
|
263
|
North West Leicestershire | 9 | 31% | 102,126 | 11347 |
|
264
|
Redditch | 8 | 0% | 90,730 | 11341 |
|
265
|
Worcester | 9 | 18% | 101,891 | 11321 |
|
266
|
Cardiff North | 8 | 38% | 90,220 | 11278 |
|
267
|
Wyre and Preston North | 8 | 56% | 90,213 | 11277 |
|
268
|
Lincoln | 10 | 41% | 112,662 | 11266 |
|
269
|
Warrington South | 10 | 47% | 112,617 | 11262 |
|
270
|
Crawley | 10 | 33% | 112,448 | 11245 |
|
271
|
Wyre Forest | 9 | 36% | 101,062 | 11229 |
|
272
|
Bury North | 8 | 38% | 89,808 | 11226 |
|
273
|
Glasgow North | 7 | 46% | 78,488 | 11213 |
|
274
|
Bracknell | 10 | 23% | 111,993 | 11199 |
|
275
|
North East Hertfordshire | 9 | 36% | 100,791 | 11199 |
|
276
|
Old Bexley and Sidcup | 8 | 47% | 89,474 | 11184 |
|
277
|
Morecambe and Lunesdale | 8 | 33% | 89,470 | 11184 |
|
278
|
Weston-Super-Mare | 10 | 33% | 111,725 | 11173 |
|
279
|
Ogmore | 7 | 30% | 78,042 | 11149 |
|
280
|
Wycombe | 10 | 29% | 111,309 | 11131 |
|
281
|
East Surrey | 9 | 44% | 99,771 | 11086 |
|
282
|
Faversham and Mid Kent | 9 | 36% | 99,649 | 11072 |
|
283
|
Burnley | 8 | 43% | 88,527 | 11066 |
|
284
|
Great Yarmouth | 9 | 25% | 99,370 | 11041 |
|
285
|
Eastbourne | 10 | 33% | 110,311 | 11031 |
|
286
|
Camberwell and Peckham | 12 | 8% | 132,209 | 11017 |
|
287
|
Morley and Outwood | 9 | 0% | 99,113 | 11013 |
|
288
|
West Suffolk | 11 | 31% | 120,899 | 10991 |
|
289
|
Stafford | 9 | 36% | 98,827 | 10981 |
|
290
|
Bromsgrove | 9 | 18% | 98,662 | 10962 |
|
291
|
Blackburn | 10 | 23% | 109,457 | 10946 |
|
292
|
Ellesmere Port and Neston | 8 | 38% | 87,522 | 10940 |
|
293
|
Luton South | 11 | 27% | 119,912 | 10901 |
|
294
|
North West Hampshire | 10 | 17% | 108,687 | 10869 |
|
295
|
Tewkesbury | 10 | 33% | 108,340 | 10834 |
|
296
|
Telford | 9 | 25% | 97,503 | 10834 |
|
297
|
Salisbury | 9 | 40% | 96,983 | 10776 |
|
298
|
Bognor Regis and Littlehampton | 10 | 23% | 107,223 | 10722 |
|
299
|
Bedford | 10 | 29% | 106,761 | 10676 |
|
300
|
Havant | 9 | 40% | 96,061 | 10673 |
|
301
|
Congleton | 9 | 47% | 96,042 | 10671 |
|
302
|
Chesham and Amersham | 9 | 47% | 95,927 | 10659 |
|
303
|
Middlesbrough | 9 | 44% | 95,925 | 10658 |
|
304
|
Bolton South East | 10 | 33% | 106,388 | 10639 |
|
305
|
South Suffolk | 9 | 25% | 95,518 | 10613 |
|
306
|
Gedling | 9 | 31% | 95,359 | 10595 |
|
307
|
Hampstead and Kilburn | 14 | 26% | 148,267 | 10591 |
|
308
|
Walsall South | 10 | 23% | 105,852 | 10585 |
|
309
|
Romford | 10 | 38% | 105,630 | 10563 |
|
310
|
Bosworth | 10 | 17% | 105,602 | 10560 |
|
311
|
Blyth Valley | 8 | 27% | 84,340 | 10543 |
|
312
|
North East Somerset | 9 | 44% | 94,879 | 10542 |
|
313
|
Chingford and Woodford Green | 9 | 50% | 94,842 | 10538 |
|
314
|
Belfast West | 9 | 25% | 94,647 | 10516 |
|
315
|
Bexleyheath and Crayford | 9 | 10% | 94,574 | 10508 |
|
316
|
Sutton Coldfield | 9 | 40% | 94,395 | 10488 |
|
317
|
Wigan | 10 | 41% | 104,850 | 10485 |
|
318
|
Nuneaton | 9 | 25% | 94,330 | 10481 |
|
319
|
Rutland and Melton | 10 | 23% | 104,698 | 10470 |
|
320
|
Belfast North | 10 | 29% | 104,457 | 10446 |
|
321
|
Plymouth, Sutton and Devonport | 11 | 35% | 114,622 | 10420 |
|
322
|
South Dorset | 9 | 31% | 93,732 | 10415 |
|
323
|
Esher and Walton | 11 | 35% | 114,517 | 10411 |
|
324
|
Birmingham, Erdington | 10 | 23% | 104,071 | 10407 |
|
325
|
Macclesfield | 9 | 44% | 93,375 | 10375 |
|
326
|
Hartlepool | 9 | 0% | 93,242 | 10360 |
|
327
|
Harrogate and Knaresborough | 10 | 47% | 103,510 | 10351 |
|
328
|
Foyle | 10 | 17% | 103,296 | 10330 |
|
329
|
St Albans | 10 | 33% | 103,181 | 10318 |
|
330
|
South Down | 11 | 27% | 113,476 | 10316 |
|
331
|
Devizes | 10 | 33% | 103,097 | 10310 |
|
332
|
Gillingham and Rainham | 10 | 23% | 102,890 | 10289 |
|
333
|
High Peak | 9 | 57% | 92,221 | 10247 |
|
334
|
Scunthorpe | 9 | 18% | 92,198 | 10244 |
|
335
|
North Antrim | 11 | 15% | 112,431 | 10221 |
|
336
|
Slough | 14 | 26% | 142,556 | 10183 |
|
337
|
Amber Valley | 9 | 40% | 90,620 | 10069 |
|
338
|
Beverley and Holderness | 10 | 33% | 100,605 | 10061 |
|
339
|
Stourbridge | 9 | 18% | 90,444 | 10049 |
|
340
|
Wantage | 12 | 43% | 120,402 | 10034 |
|
341
|
Birkenhead | 9 | 31% | 90,212 | 10024 |
|
342
|
Cannock Chase | 10 | 33% | 100,109 | 10011 |
|
343
|
North East Cambridgeshire | 12 | 40% | 119,770 | 9981 |
|
344
|
Wimbledon | 10 | 44% | 99,774 | 9977 |
|
345
|
Henley | 10 | 33% | 99,597 | 9960 |
|
346
|
Sittingbourne and Sheppey | 12 | 8% | 119,331 | 9944 |
|
347
|
Bishop Auckland | 9 | 40% | 89,415 | 9935 |
|
348
|
Spelthorne | 10 | 29% | 99,334 | 9933 |
|
349
|
Newport West | 9 | 18% | 89,235 | 9915 |
|
350
|
Great Grimsby | 9 | 44% | 88,565 | 9841 |
|
351
|
Aberavon | 7 | 13% | 68,649 | 9807 |
|
352
|
North Durham | 9 | 36% | 88,088 | 9788 |
|
353
|
Blaydon | 9 | 36% | 87,978 | 9775 |
|
354
|
Sevenoaks | 10 | 29% | 97,596 | 9760 |
|
355
|
Gainsborough | 10 | 33% | 97,423 | 9742 |
|
356
|
Erewash | 10 | 23% | 97,354 | 9735 |
|
357
|
South West Surrey | 11 | 45% | 106,770 | 9706 |
|
358
|
Windsor | 11 | 21% | 106,412 | 9674 |
|
359
|
Bexhill and Battle | 11 | 42% | 106,127 | 9648 |
|
360
|
Rochford and Southend East | 11 | 39% | 105,895 | 9627 |
|
361
|
Halifax | 11 | 27% | 105,233 | 9567 |
|
362
|
Ashford | 13 | 32% | 123,871 | 9529 |
|
363
|
Meon Valley | 10 | 17% | 95,119 | 9512 |
|
364
|
Ipswich | 12 | 40% | 113,666 | 9472 |
|
365
|
Horsham | 12 | 33% | 113,486 | 9457 |
|
366
|
Watford | 13 | 38% | 122,561 | 9428 |
|
367
|
Cheadle | 10 | 41% | 93,826 | 9383 |
|
368
|
Croydon Central | 13 | 28% | 121,510 | 9347 |
|
369
|
Newbury | 12 | 37% | 112,045 | 9337 |
|
370
|
City of Durham | 11 | 31% | 102,534 | 9321 |
|
371
|
Hastings and Rye | 12 | 40% | 111,806 | 9317 |
|
372
|
South Shields | 9 | 25% | 83,796 | 9311 |
|
373
|
Uxbridge and South Ruislip | 12 | 20% | 111,453 | 9288 |
|
374
|
Chelmsford | 12 | 25% | 111,377 | 9281 |
|
375
|
Livingston | 12 | 14% | 111,369 | 9281 |
|
376
|
Sefton Central | 9 | 40% | 83,401 | 9267 |
|
377
|
Warwick and Leamington | 11 | 42% | 101,894 | 9263 |
|
378
|
Ashton-under-Lyne | 10 | 33% | 92,602 | 9260 |
|
379
|
Hornchurch and Upminster | 12 | 33% | 111,035 | 9253 |
|
380
|
Crewe and Nantwich | 12 | 25% | 110,828 | 9236 |
|
381
|
Orpington | 10 | 38% | 92,348 | 9235 |
|
382
|
Canterbury | 13 | 24% | 120,042 | 9234 |
|
383
|
South Thanet | 11 | 48% | 101,569 | 9234 |
|
384
|
Wansbeck | 9 | 18% | 82,768 | 9196 |
|
385
|
Cumbernauld, Kilsyth and Kirkintilloch East
|
7 | 22% | 64,322 | 9189 |
|
386
|
Darlington | 10 | 17% | 91,872 | 9187 |
|
387
|
Witney | 12 | 40% | 109,800 | 9150 |
|
388
|
Epping Forest | 11 | 35% | 100,618 | 9147 |
|
389
|
Barnsley Central | 10 | 17% | 91,272 | 9127 |
|
390
|
South West Norfolk | 12 | 37% | 109,360 | 9113 |
|
391
|
Lagan Valley | 12 | 20% | 109,173 | 9098 |
|
392
|
Louth and Horncastle | 11 | 45% | 100,022 | 9093 |
|
393
|
Folkestone and Hythe | 13 | 41% | 117,988 | 9076 |
|
394
|
Clwyd South | 8 | 33% | 72,523 | 9065 |
|
395
|
North Herefordshire | 10 | 44% | 90,435 | 9044 |
|
396
|
Welwyn Hatfield | 13 | 19% | 117,380 | 9029 |
|
397
|
Clacton | 10 | 23% | 90,266 | 9027 |
|
398
|
Liverpool, Riverside | 15 | 38% | 135,228 | 9015 |
|
399
|
Manchester, Withington | 11 | 35% | 99,133 | 9012 |
|
400
|
Poole | 11 | 54% | 98,839 | 8985 |
|
401
|
Burton | 12 | 37% | 107,249 | 8937 |
|
402
|
North West Norfolk | 11 | 31% | 97,885 | 8899 |
|
403
|
Brigg and Goole | 10 | 33% | 88,904 | 8890 |
|
404
|
Portsmouth South | 13 | 24% | 115,429 | 8879 |
|
405
|
Colchester | 14 | 26% | 123,794 | 8842 |
|
406
|
Birmingham, Edgbaston | 12 | 14% | 105,856 | 8821 |
|
407
|
Hendon | 16 | 33% | 141,138 | 8821 |
|
408
|
Glenrothes | 10 | 17% | 87,931 | 8793 |
|
409
|
Northampton North | 10 | 41% | 87,890 | 8789 |
|
410
|
Wellingborough | 13 | 13% | 113,822 | 8756 |
|
411
|
Christchurch | 10 | 33% | 86,987 | 8699 |
|
412
|
Barrow and Furness | 10 | 38% | 86,728 | 8673 |
|
413
|
Stoke-on-Trent Central | 10 | 38% | 86,669 | 8667 |
|
414
|
Newcastle-under-Lyme | 11 | 15% | 94,566 | 8597 |
|
415
|
St Helens South and Whiston | 12 | 25% | 103,046 | 8587 |
|
416
|
Manchester Central | 19 | 51% | 162,656 | 8561 |
|
417
|
Dudley North | 10 | 23% | 85,362 | 8536 |
|
418
|
Paisley and Renfrewshire South | 10 | 23% | 85,265 | 8527 |
|
419
|
Doncaster Central | 13 | 28% | 110,733 | 8518 |
|
420
|
East Yorkshire | 13 | 32% | 110,693 | 8515 |
|
421
|
Islwyn | 9 | 25% | 76,614 | 8513 |
|
422
|
Fareham | 12 | 25% | 102,018 | 8502 |
|
423
|
Motherwell and Wishaw | 9 | 10% | 76,394 | 8488 |
|
424
|
Rayleigh and Wickford | 12 | 20% | 101,666 | 8472 |
|
425
|
Runnymede and Weybridge | 13 | 32% | 110,109 | 8470 |
|
426
|
Beckenham | 11 | 15% | 93,099 | 8464 |
|
427
|
Stockton North | 11 | 21% | 92,832 | 8439 |
|
428
|
Bury St Edmunds | 14 | 30% | 118,041 | 8432 |
|
429
|
Huddersfield | 12 | 25% | 100,991 | 8416 |
|
430
|
Wakefield | 12 | 29% | 100,438 | 8370 |
|
431
|
Strangford | 11 | 35% | 91,796 | 8345 |
|
432
|
South Holland and The Deepings | 13 | 35% | 108,114 | 8316 |
|
433
|
Llanelli | 10 | 17% | 83,136 | 8314 |
|
434
|
Chippenham | 12 | 37% | 99,744 | 8312 |
|
435
|
Mid Dorset and North Poole | 10 | 38% | 82,985 | 8299 |
|
436
|
Boston and Skegness | 13 | 0% | 107,531 | 8272 |
|
437
|
Dartford | 14 | 18% | 115,749 | 8268 |
|
438
|
Broadland | 12 | 29% | 99,170 | 8264 |
|
439
|
Guildford | 14 | 42% | 115,030 | 8216 |
|
440
|
Reigate | 13 | 35% | 106,612 | 8201 |
|
441
|
South West Devon | 11 | 39% | 90,019 | 8184 |
|
442
|
Cheltenham | 13 | 35% | 106,333 | 8179 |
|
443
|
Halesowen and Rowley Regis | 11 | 27% | 89,529 | 8139 |
|
444
|
Wirral South | 9 | 36% | 73,195 | 8133 |
|
445
|
Stockport | 11 | 35% | 89,269 | 8115 |
|
446
|
Normanton, Pontefract and Castleford | 14 | 30% | 113,546 | 8110 |
|
447
|
Mole Valley | 12 | 25% | 97,208 | 8101 |
|
448
|
Leicester South | 16 | 36% | 129,396 | 8087 |
|
449
|
York Central | 14 | 22% | 113,152 | 8082 |
|
450
|
Rochester and Strood | 14 | 18% | 113,121 | 8080 |
|
451
|
City of Chester | 12 | 29% | 96,899 | 8075 |
|
452
|
South West Bedfordshire | 14 | 7% | 112,961 | 8069 |
|
453
|
Nottingham South | 15 | 42% | 120,366 | 8024 |
|
454
|
Caerphilly | 11 | 21% | 88,262 | 8024 |
|
455
|
West Worcestershire | 12 | 40% | 96,281 | 8023 |
|
456
|
Brent North | 17 | 23% | 136,270 | 8016 |
|
457
|
Hertsmere | 13 | 24% | 104,205 | 8016 |
|
458
|
Bromley and Chislehurst | 12 | 37% | 96,043 | 8004 |
|
459
|
Gloucester | 15 | 21% | 119,941 | 7996 |
|
460
|
Mid Worcestershire | 13 | 24% | 103,431 | 7956 |
|
461
|
Liverpool, Wavertree | 12 | 14% | 95,353 | 7946 |
|
462
|
Thornbury and Yate | 11 | 27% | 87,378 | 7943 |
|
463
|
Cynon Valley | 9 | 31% | 71,043 | 7894 |
|
464
|
Dover | 13 | 0% | 102,530 | 7887 |
|
465
|
Ludlow | 11 | 39% | 86,615 | 7874 |
|
466
|
Sheffield Central | 17 | 45% | 133,660 | 7862 |
|
467
|
North Shropshire | 14 | 36% | 109,995 | 7857 |
|
468
|
Battersea | 15 | 12% | 117,649 | 7843 |
|
469
|
East Londonderry | 13 | 24% | 101,795 | 7830 |
|
470
|
Sunderland Central | 13 | 35% | 101,695 | 7823 |
|
471
|
Northampton South | 13 | 38% | 101,603 | 7816 |
|
472
|
Inverclyde | 10 | 23% | 78,150 | 7815 |
|
473
|
Arundel and South Downs | 13 | 55% | 101,579 | 7814 |
|
474
|
Richmond (Yorks) | 14 | 42% | 109,158 | 7797 |
|
475
|
Camborne and Redruth | 12 | 37% | 92,978 | 7748 |
|
476
|
Tunbridge Wells | 14 | 36% | 107,957 | 7711 |
|
477
|
Dunfermline and West Fife | 10 | 23% | 77,005 | 7701 |
|
478
|
Ealing Central and Acton | 16 | 27% | 122,985 | 7687 |
|
479
|
Newton Abbot | 12 | 29% | 91,845 | 7654 |
|
480
|
North Down | 12 | 20% | 91,729 | 7644 |
|
481
|
Pudsey | 12 | 33% | 91,694 | 7641 |
|
482
|
Putney | 13 | 28% | 99,230 | 7633 |
|
483
|
Swansea West | 11 | 48% | 83,428 | 7584 |
|
484
|
Aldershot | 14 | 22% | 105,601 | 7543 |
|
485
|
Waveney | 14 | 26% | 105,282 | 7520 |
|
486
|
Weaver Vale | 12 | 33% | 90,205 | 7517 |
|
487
|
Scarborough and Whitby | 13 | 28% | 97,109 | 7470 |
|
488
|
Preston | 13 | 28% | 96,719 | 7440 |
|
489
|
Hitchin and Harpenden | 14 | 7% | 104,025 | 7430 |
|
490
|
Hammersmith | 16 | 6% | 118,780 | 7424 |
|
491
|
Dudley South | 11 | 39% | 81,386 | 7399 |
|
492
|
South West Wiltshire | 14 | 33% | 103,296 | 7378 |
|
493
|
Suffolk Coastal | 14 | 42% | 103,243 | 7375 |
|
494
|
Milton Keynes North | 18 | 28% | 132,698 | 7372 |
|
495
|
Oxford West and Abingdon | 15 | 32% | 110,282 | 7352 |
|
496
|
Banbury | 17 | 11% | 124,450 | 7321 |
|
497
|
Maidstone and The Weald | 15 | 25% | 109,591 | 7306 |
|
498
|
Sutton and Cheam | 14 | 39% | 101,980 | 7284 |
|
499
|
Central Ayrshire | 12 | 37% | 87,329 | 7277 |
|
500
|
St Ives | 12 | 37% | 87,315 | 7276 |
|
501
|
Torridge and West Devon | 14 | 39% | 101,844 | 7275 |
|
502
|
South Swindon | 15 | 38% | 109,015 | 7268 |
|
503
|
Chesterfield | 13 | 13% | 94,231 | 7249 |
|
504
|
Aberdeen North | 14 | 36% | 101,461 | 7247 |
|
505
|
Gower | 11 | 31% | 79,504 | 7228 |
|
506
|
Stratford-on-Avon | 13 | 32% | 93,810 | 7216 |
|
507
|
Somerton and Frome | 15 | 29% | 107,727 | 7182 |
|
508
|
Bassetlaw | 15 | 12% | 107,497 | 7166 |
|
509
|
Brentford and Isleworth | 19 | 17% | 135,834 | 7149 |
|
510
|
Islington South and Finsbury | 17 | 29% | 121,433 | 7143 |
|
511
|
Mid Norfolk | 15 | 17% | 106,983 | 7132 |
|
512
|
Bridgwater and West Somerset | 16 | 20% | 113,714 | 7107 |
|
513
|
Dundee East | 10 | 23% | 70,971 | 7097 |
|
514
|
Upper Bann | 18 | 10% | 127,592 | 7088 |
|
515
|
North Thanet | 14 | 26% | 99,200 | 7086 |
|
516
|
Leeds Central | 22 | 27% | 155,749 | 7080 |
|
517
|
Newry and Armagh | 17 | 19% | 119,966 | 7057 |
|
518
|
Stroud | 15 | 35% | 105,686 | 7046 |
|
519
|
Hexham | 11 | 39% | 77,334 | 7030 |
|
520
|
East Dunbartonshire | 12 | 37% | 84,049 | 7004 |
|
521
|
Grantham and Stamford | 16 | 20% | 111,477 | 6967 |
|
522
|
Southampton, Itchen | 16 | 11% | 110,362 | 6898 |
|
523
|
Peterborough | 18 | 10% | 124,103 | 6895 |
|
524
|
Basildon and Billericay | 14 | 18% | 96,192 | 6871 |
|
525
|
Harrow West | 16 | 30% | 109,879 | 6867 |
|
526
|
Derby South | 17 | 32% | 116,163 | 6833 |
|
527
|
Chelsea and Fulham | 16 | 11% | 109,198 | 6825 |
|
528
|
Exeter | 17 | 29% | 115,643 | 6803 |
|
529
|
Winchester | 15 | 32% | 102,030 | 6802 |
|
530
|
Wolverhampton South West | 13 | 38% | 88,339 | 6795 |
|
531
|
Thirsk and Malton | 15 | 42% | 101,767 | 6784 |
|
532
|
Hereford and South Herefordshire | 15 | 21% | 101,672 | 6778 |
|
533
|
Bristol West | 21 | 40% | 142,156 | 6769 |
|
534
|
Sheffield South East | 14 | 22% | 94,686 | 6763 |
|
535
|
Hertford and Stortford | 17 | 29% | 114,426 | 6731 |
|
536
|
Huntingdon | 18 | 14% | 120,029 | 6668 |
|
537
|
Lewes | 14 | 30% | 93,324 | 6666 |
|
538
|
Harborough | 16 | 16% | 106,503 | 6656 |
|
539
|
West Tyrone | 14 | 22% | 93,151 | 6654 |
|
540
|
East Devon | 16 | 41% | 106,349 | 6647 |
|
541
|
Blackpool South | 12 | 37% | 79,455 | 6621 |
|
542
|
Finchley and Golders Green | 20 | 35% | 132,223 | 6611 |
|
543
|
West Dorset | 15 | 40% | 98,748 | 6583 |
|
544
|
Chichester | 17 | 35% | 111,299 | 6547 |
|
545
|
Lancaster and Fleetwood | 14 | 30% | 91,595 | 6543 |
|
546
|
Keighley | 15 | 17% | 97,486 | 6499 |
|
547
|
Bath | 15 | 35% | 97,227 | 6482 |
|
548
|
Dundee West | 12 | 37% | 77,779 | 6482 |
|
549
|
Reading East | 18 | 31% | 116,095 | 6450 |
|
550
|
Wealden | 17 | 32% | 109,367 | 6433 |
|
551
|
Torfaen | 13 | 19% | 83,145 | 6396 |
|
552
|
Broxbourne | 16 | 24% | 102,242 | 6390 |
|
553
|
West Dunbartonshire | 14 | 22% | 89,130 | 6366 |
|
554
|
Merthyr Tydfil and Rhymney | 12 | 8% | 76,326 | 6361 |
|
555
|
Delyn | 11 | 27% | 69,847 | 6350 |
|
556
|
Pontypridd | 13 | 35% | 82,250 | 6327 |
|
557
|
Aberdeen South | 15 | 35% | 94,831 | 6322 |
|
558
|
Berwick-upon-Tweed | 12 | 29% | 75,832 | 6319 |
|
559
|
Coventry South | 20 | 33% | 125,912 | 6296 |
|
560
|
Torbay | 16 | 33% | 100,345 | 6272 |
|
561
|
Worthing West | 16 | 30% | 99,512 | 6220 |
|
562
|
Yeovil | 18 | 28% | 111,511 | 6195 |
|
563
|
Totnes | 14 | 50% | 86,418 | 6173 |
|
564
|
Oxford East | 20 | 29% | 122,993 | 6150 |
|
565
|
Cambridge | 19 | 24% | 116,540 | 6134 |
|
566
|
Norwich South | 17 | 32% | 104,215 | 6130 |
|
567
|
Clwyd West | 12 | 45% | 73,539 | 6128 |
|
568
|
Hornsey and Wood Green | 21 | 13% | 128,616 | 6125 |
|
569
|
Belfast South | 19 | 42% | 115,781 | 6094 |
|
570
|
Preseli Pembrokeshire | 13 | 38% | 79,178 | 6091 |
|
571
|
Beaconsfield | 17 | 26% | 102,799 | 6047 |
|
572
|
Bridgend | 14 | 33% | 84,135 | 6010 |
|
573
|
North Devon | 16 | 43% | 96,110 | 6007 |
|
574
|
Angus | 24 | 33% | 143,765 | 5990 |
|
575
|
Wrexham | 12 | 20% | 71,222 | 5935 |
|
576
|
Eastleigh | 12 | 14% | 71,066 | 5922 |
|
577
|
Birmingham, Ladywood | 25 | 40% | 147,715 | 5909 |
|
578
|
Skipton and Ripon | 17 | 45% | 100,236 | 5896 |
|
579
|
Bournemouth West | 18 | 28% | 105,337 | 5852 |
|
580
|
Kingston upon Hull West and Hessle | 15 | 38% | 87,308 | 5821 |
|
581
|
Ochil and South Perthshire | 18 | 33% | 104,639 | 5813 |
|
582
|
Lanark and Hamilton East | 17 | 43% | 98,038 | 5767 |
|
583
|
Derbyshire Dales | 14 | 53% | 80,340 | 5739 |
|
584
|
Tatton | 15 | 35% | 85,968 | 5731 |
|
585
|
Tiverton and Honiton | 18 | 36% | 103,139 | 5730 |
|
586
|
The Cotswolds | 18 | 31% | 102,355 | 5686 |
|
587
|
Vale of Glamorgan | 18 | 22% | 102,352 | 5686 |
|
588
|
Mid Sussex | 20 | 13% | 113,534 | 5677 |
|
589
|
Brighton, Pavilion | 20 | 17% | 113,318 | 5666 |
|
590
|
South East Cornwall | 16 | 38% | 90,314 | 5645 |
|
591
|
Carmarthen East and Dinefwr | 13 | 48% | 72,469 | 5575 |
|
592
|
East Kilbride, Strathaven and Lesmahagow
|
14 | 18% | 77,300 | 5521 |
|
593
|
East Hampshire | 18 | 22% | 99,087 | 5505 |
|
594
|
North Dorset | 18 | 28% | 98,617 | 5479 |
|
595
|
Enfield, Southgate | 19 | 14% | 103,313 | 5438 |
|
596
|
Ruislip, Northwood and Pinner | 18 | 38% | 97,690 | 5427 |
|
597
|
Fermanagh and South Tyrone | 20 | 13% | 108,495 | 5425 |
|
598
|
Carlisle | 16 | 16% | 86,496 | 5406 |
|
599
|
Edinburgh North and Leith | 21 | 46% | 113,482 | 5404 |
|
600
|
Solihull | 19 | 14% | 102,349 | 5387 |
|
601
|
Wells | 20 | 38% | 107,468 | 5373 |
|
602
|
Kingston and Surbiton | 24 | 25% | 127,292 | 5304 |
|
603
|
Kensington | 22 | 31% | 113,645 | 5166 |
|
604
|
Truro and Falmouth | 19 | 30% | 96,491 | 5078 |
|
605
|
Ynys Môn | 14 | 42% | 69,961 | 4997 |
|
606
|
St Austell and Newquay | 22 | 33% | 107,530 | 4888 |
|
607
|
North Norfolk | 18 | 40% | 87,337 | 4852 |
|
608
|
Vale of Clwyd | 15 | 32% | 72,146 | 4810 |
|
609
|
Gordon | 22 | 12% | 103,910 | 4723 |
|
610
|
Cardiff Central | 20 | 23% | 93,898 | 4695 |
|
611
|
Neath | 16 | 11% | 74,257 | 4641 |
|
612
|
Holborn and St Pancras | 35 | 30% | 159,344 | 4553 |
|
613
|
Newcastle upon Tyne Central | 23 | 12% | 104,633 | 4549 |
|
614
|
Monmouth | 19 | 24% | 86,212 | 4537 |
|
615
|
Glasgow Central | 23 | 43% | 103,461 | 4498 |
|
616
|
Central Devon | 21 | 40% | 94,135 | 4483 |
|
617
|
Kilmarnock and Loudoun | 19 | 17% | 82,864 | 4361 |
|
618
|
Montgomeryshire | 15 | 35% | 63,297 | 4220 |
|
619
|
Workington | 19 | 32% | 79,650 | 4192 |
|
620
|
Arfon | 15 | 17% | 62,757 | 4184 |
|
621
|
Kirkcaldy and Cowdenbeath | 19 | 32% | 78,351 | 4124 |
|
622
|
New Forest West | 21 | 19% | 86,139 | 4102 |
|
623
|
Isle of Wight | 35 | 26% | 141,538 | 4044 |
|
624
|
Carmarthen West and South Pembrokeshire
|
20 | 44% | 77,840 | 3892 |
|
625
|
Penrith and The Border | 22 | 31% | 82,633 | 3756 |
|
626
|
North Cornwall | 25 | 29% | 93,582 | 3743 |
|
627
|
Brecon and Radnorshire | 19 | 42% | 69,150 | 3639 |
|
628
|
Perth and North Perthshire | 42 | 16% | 151,290 | 3602 |
|
629
|
Copeland | 22 | 33% | 78,440 | 3565 |
|
630
|
Aberconwy | 17 | 32% | 59,207 | 3483 |
|
631
|
North East Fife | 22 | 29% | 75,226 | 3419 |
|
632
|
Dwyfor Meirionnydd | 18 | 44% | 61,421 | 3412 |
|
633
|
Ceredigion | 24 | 25% | 72,992 | 3041 |
|
634
|
Inverness, Nairn, Badenoch and Strathspey
|
31 | 16% | 89,755 | 2895 |
|
635
|
Westmorland and Lonsdale | 31 | 33% | 84,941 | 2740 |
|
636
|
Aberdeenshire West and Kincardine | 37 | 16% | 97,136 | 2625 |
|
637
|
Ayr, Carrick and Cumnock | 36 | 14% | 91,799 | 2550 |
|
638
|
Banff and Buchan | 30 | 21% | 75,612 | 2520 |
|
639
|
East Lothian | 34 | 15% | 79,505 | 2338 |
|
640
|
Dumfries and Galloway | 41 | 20% | 95,409 | 2327 |
|
641
|
Dumfriesshire, Clydesdale and Tweeddale
|
39 | 15% | 86,345 | 2214 |
|
642
|
Orkney and Shetland | 21 | 9% | 45,180 | 2151 |
|
643
|
Moray | 41 | 28% | 80,367 | 1960 |
|
644
|
Stirling | 42 | 19% | 77,002 | 1833 |
|
645
|
Berwickshire, Roxburgh and Selkirk | 52 | 22% | 94,825 | 1824 |
|
646
|
North Ayrshire and Arran | 54 | 19% | 93,645 | 1734 |
|
647
|
Cities of London and Westminster | 112 | 29% | 129,893 | 1160 |
|
648
|
Caithness, Sutherland and Easter Ross | 67 | 17% | 69,767 | 1041 |
|
649
|
Argyll and Bute | 119 | 6% | 60,394 | 508 |
|
650
|
Ross, Skye and Lochaber | 219 | 4% | 69,381 | 317 |
|
651
|
Na h-Eileanan an Iar | 108 | 0% | 26,830 | 248 |
Are high street banks replaceable?
Post Offices
Since 2007, the number of people using the internet for online banking has increased by 46 per cent according to the Office for National Statistics emphasising a huge shift in the way we manage our money. For those who prefer an in-person service, Post Offices are regularly mentioned as an alternative to visiting the bank.
However, while the number of Post Offices in the UK has remained fairly consistent since 2009, the number of banks has considerably decreased over the last five years. In addition, our study shows just 23 per cent of Brits use the Post Office for banking services with more than 14 per cent of people unaware they can even use the Post Office for financial tasks.
Mobile banking
While the survival of high street banking will no doubt be made all the more difficult due to the ongoing coronavirus crisis, there is yet to be a viable alternative to in-person banking for those wanting a more extensive service to the one provided online.
A number of banking groups including NatWest and Lloyds have invested in mobile banking vans which visit communities in an attempt to fill the void left by branch closures. However, they generally only visit local areas once a week.
The right to access a bank
Although people currently don’t have the right to access a physical branch, over the last five years the government has carried out a number of reviews into the impact bank closures are having on local communities. In 2017, the banking industry introduced an ‘Access to Banking Standard’ which outlined the steps banks should take before closing a branch. Banks also vowed to be more transparent with customers about the closures and committed to conducting impact assessments before taking the decision to shut.
Most recently, the chancellor, Rishi Sunak announced the government would commit to new laws to protect the future of cash but as of yet little progress has been made.
A cashless future?
While UK finance has predicted just nine per cent of all payments in 2028 will be made by cash, it is clear there is a need to protect high street banks. Although the high street continues to evolve, the security of physical branches must be made a priority before it is too late.
Online banking provides a viable alternative to visiting a bank for many but for millions of others it fails to come close to meeting their nuanced needs. Alternatives to in-person banking should certainly be explored but not at the expense of physical branches and the people who rely on access to cash.