- Bitcoin’s recent price surge has been eye-watering. Those who took long positions at March lows could have more than doubled their money.
- The ‘halving’, which happened last week, might have been the trigger of the rise, but there are indications that price might push on to higher levels.
- A combination of classic technical indicators and macro-analysis offers an insight into why the rally might be about to continue.
The price of bitcoin has, in just over two months, more than doubled. It has rocketed by 150% from 3,908 to 9,752. The anticipation of the ‘halving,’ which occurred on the 11th of May, has been explained as the catalyst for the price increase. The question of ‘what happens now?’ has so far not been adequately answered. Recent price moves suggest that it could be the bulls who are about to come out on top. Cross-referencing to historical price movements and other asset markets suggests a long position entry level is forming.
Bitcoin – Daily Candles – 5th March – 18th May 2020
 WELCOME BONUS - Free Share Bundle When You Invest £50!
Get up to £500 cashback for investing with IG.
WELCOME BONUS - Free Share Bundle When You Invest £50!
Get up to £500 cashback for investing with IG.
The cryptocurrency is known for doing things differently. The ‘halving’ is one example, and even the process of how it was founded is shrouded in mystery. Basic market fundamentals don’t always apply, but one core indicator just gave off a big buy-signal. Finding the signal is as easy as checking on the price charts found at IG.
The price charts show that since the halving, price action has generally been bullish. There has been some weakness, most notably immediately after the event on the 12th of May. As with the previous ‘halvings’ of 2016 and 2012, it looks like the price might now ‘kick-on’. Significantly, short-term confidence levels will have been boosted by BTC, making a higher high on the 18th of May.
The yellow dots on the line-chart show each higher-high of the bull run. The principle of higher highs (and higher lows) marking a bull market is as strong as it is simple. For that reason, the red dot on the 14th of May caused concern for the bulls. The high of that day was 9,939 and marked the top of that wave of price action and was lower than the previous high, 10,071 on the 8th of May.
Bitcoin – 5th April – 18th May 2020
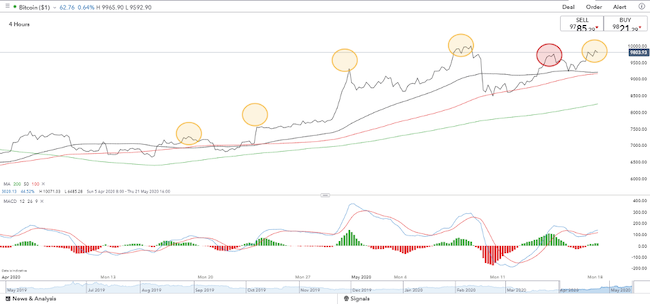
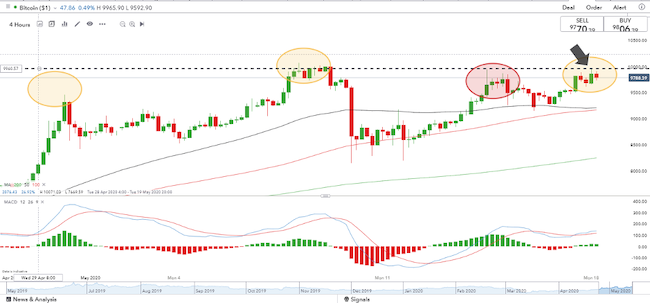
The idea of a price reversal first found support from bears able to suggest that the event had passed. The saying ‘buy the rumour, sell the fact’ has been shared around the markets long far longer than cryptocurrencies have been trading. Price has since rallied but not to the extent that there is much fear that the opportunity has been missed.
Understanding the mechanics of the ‘halving’ can help explain why it might not necessarily leave those long with a costly hangover. The four-yearly event, which reduces the amount of supply of new coins, effectively makes mining them more expensive. The theory goes that with revenues ‘halved’ but production costs such as electricity fixed, miners have to receive a higher price for the coins they release into the market. Even the funky-new-age world of bitcoin obeys the business fundamental that if miners can’t cover their costs, they move out of the business. If demand remains strong, then as production levels fall, lower supply levels lead to higher prices.
Digging around
Given that they cover more than 10,000 markets, it’s impressive that IG provides such comprehensive research and analysis. The below chart comes from their coverage of bitcoin, which can be found here.
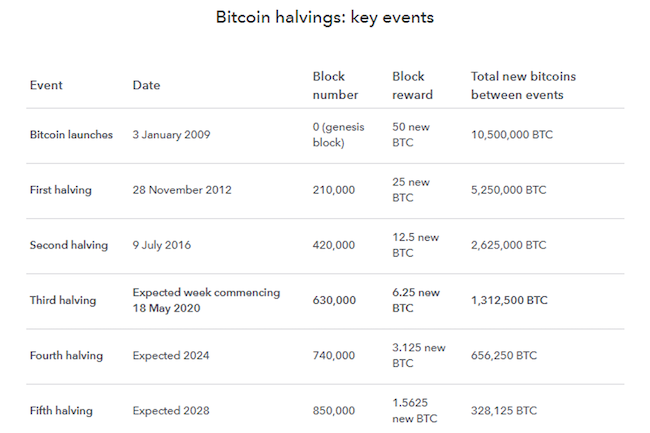
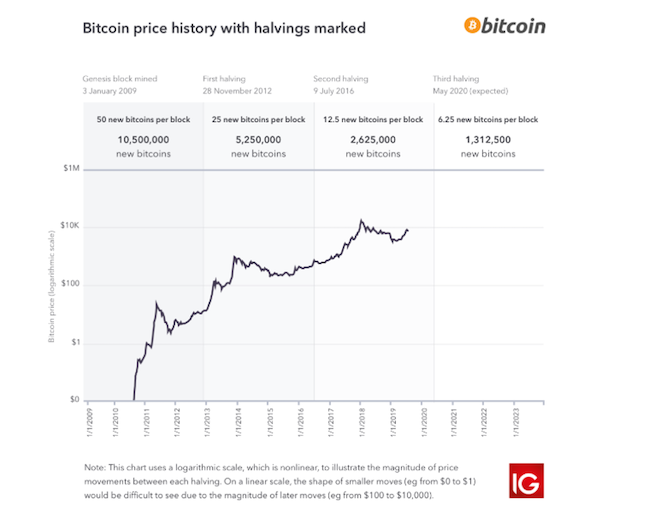
The historical price chart, which covers previous halvings, also forms support for those expecting the price to continue after the event.
 Source: IG
Support from the sidelines
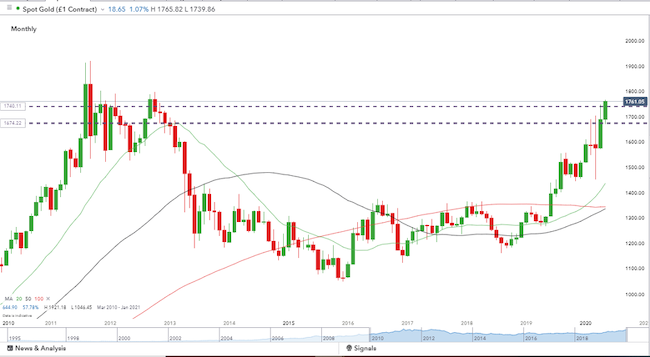
Price correlation between gold and bitcoin has developed as the crypto is seen as the safe-haven asset for the digital generation. A scan of gold prices, therefore, provides a confirmation signal for bitcoin bulls looking to enter a long-position at IG.
The precious metal looks set to post its sixth consecutive up day. The momentum helping it break through the resistance level of 1,739 and to now trade at eight-year highs.
Gold – Monthly candles – March 2010 – May 2020
Circling back to the principle of ‘higher-highs’ the chart for gold prices in May shows that like bitcoin, gold posted a tentative ‘lower-high’ (on the 8th of May).
Gold – Line Chart – 23rd March – 18th May 2020
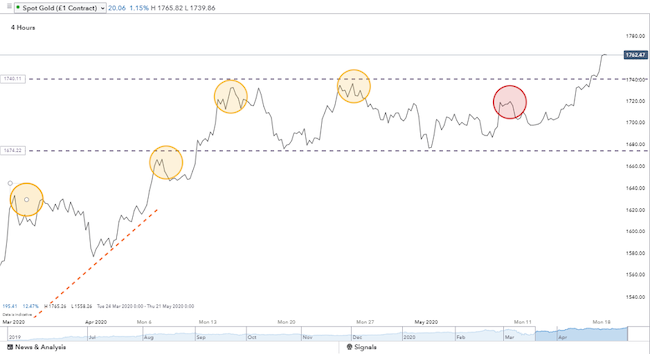
Gold’s break to the upside has been dramatic. Taking the metal as a leading indicator for BTC prices gives hope to the bulls. Also, posting multi-year highs will mean the metal receives more extensive press coverage, and that will generate interest from the retail sector. Bitcoin, by association, could benefit from increased interest in shared features of the two assets. Both can be analysed and traded on the IG platform, and there could be profits for those who think the recent strong price action has more room to run.
While high prices have been associated with the months before and after previous halvings, causing bitcoin’s price to rise considerably, the circumstances surrounding each halving are different and past performance is never an indication of future returns.
Prices of cryptos can fluctuate wildly. There is a reason that regulated brokers such as IG that take client interests seriously limit the leverage in the markets to 1:1. With prices moving by 150% in a matter of weeks, even those T&C’s offer investors a wild ride.