
Here we review the world’s number two cryptocurrency by size, Ether (ETH), from a charting perspective, looking at the technical analysis outlook describing possible price triggers and forecasts, both higher and also below.
eToro is a multi-asset investment platform. The value of your investments may go up or down. Your capital is at risk.
Cryptocurrencies In Holding Patterns
As we highlighted in our report yesterday, the wider cryptocurrency space sees cryptocurrencies and altcoins in consolidation phases, from both a short- and intermediate-term perspective. Markets are continuing to digest losses inflicted by the collapse of FTX in early November. November losses sent many cryptocurrencies to new cycle lows for the year, though some cryptocurrencies, including Ether, have held above the lows posted predominantly in the early summer of 2022.
 WELCOME BONUS - Free Share Bundle When You Invest £50!
Get up to £500 cashback for investing with IG.
WELCOME BONUS - Free Share Bundle When You Invest £50!
Get up to £500 cashback for investing with IG.
Top Broker Recommendation
- IG Top-tier regulation – Read our Review
- eToro Wide range of instruments available to trade – Read our Review
YOUR CAPITAL IS AT RISK. 76% OF RETAIL CFD ACCOUNTS LOSE MONEY
Regardless of the nuances of the various chart setups, most cryptocurrencies are currently in holding patterns, wavering between positive price action evidenced in the latter summer and in October of 2022, and bearish pressures from the bear markets seen in 2022 and more lately in Q4 of this year from the implosion of FTX.
From our charting viewpoint, the bias for Ether is skewed to the upside and for a bigger bottoming pattern being built and then for a more robust upturn, possibly into the very end of 2022, but more likely into the first quarter of 2023.
Ether Technical Analysis View
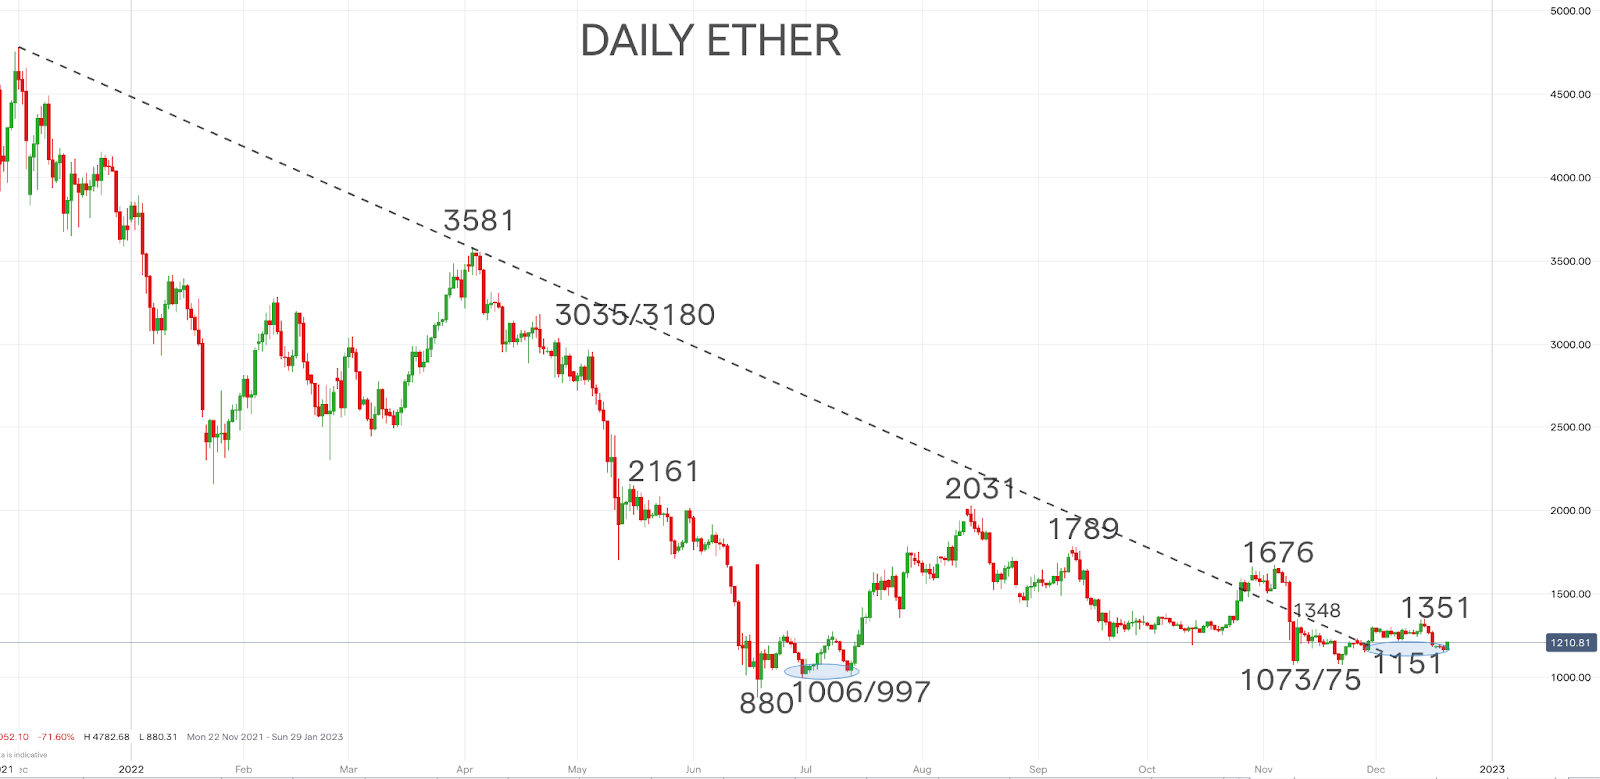
The Ethereum sell off at the beginning of November manage to hold significantly above the current 2022 bear market low at 880, rebounding from 1073, then holding here again on a retest through the second half of November, bouncing from 1075, to then signal a small Double Bottom pattern with a nudge just above resistance at 1348 up to 1351.
Despite the subsequent setback from here over the past week, ETH/USD is currently holding above even initial, modest support at 1151, bouncing exactly from this level over the past 24 hours. Alongside the erratic recovery phase seen since the June low was established at 880, the market is displaying a still positive bias to a broader, intermediate-term basing phase. This lends a positive technical analysis bias through year-end and into Q1 2023.
Ether Upside Threats and Downside Risks
Bullish Bias and Targets: We see a bullish chart set up for ETH and upside prospects through year-end into January. In this timeline we could see a rebound back to the recent high at 1351 and even towards the November swing peak at 1676. Further into Q1 2023, should we move above 1676, the threat would be for a more robust recovery phase to aim for targets at 1789, 2031 and even 2161.
Bearish Risks and Triggers: Below 1151 would establish a more negative bias for Ether and would set up risk to test the November lows at 1073/75. Surrender here would see a more negative turn and likely encourage a challenge to July supports clustered at 1006/997 and possibly even down to the bear market low at 880.


eToro is a multi-asset investment platform. The value of your investments may go up or down. Your capital is at risk.
