
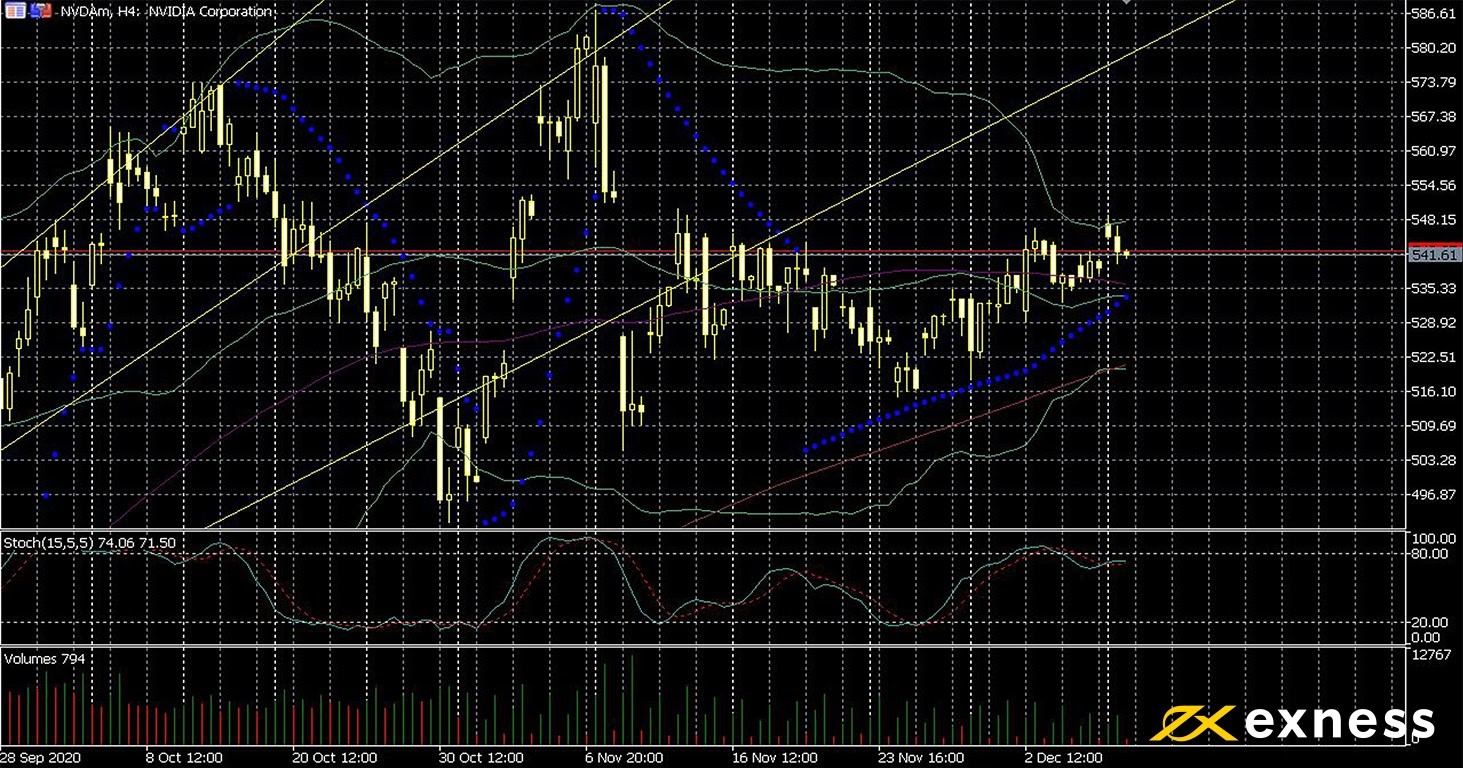
NVDA, the representative CFD based on NVIDIA Corp’s stock, continued to strengthen yesterday, reaching a monthly high at yesterday’s open of $548.88. Like some other large cap cyclical shares, NVDA has settled into a range since the start of November amid relatively lower volatility.
The positive outlook for NVDA and competitor AMD has become clearer over the last few weeks as bitcoin and various major altcoins have made gains, driving demand for the most advanced GPUs for mining. NVIDIA sold around $175 million worth of the latest RTX 30 series of graphics cards in just one month last quarter. Strong quarterly growth in revenue from NVIDIA’s data centres also continues to attract the attention of traders and investors.
NVIDIA’s last reported earnings on 18 November came in at $2.41 per share, a fairly significant surprise compared to the consensus of $1.92 and Q3 2019’s $1.67. This takes the company’s price: earnings ratio (‘PE’) for 2020 so far to slightly under 120. NVIDIA then is among the less overvalued major tech stocks based on PE.

Back on the chart, high resistance and low support are likely to occur around the latest high and latest low at $585 and $495 respectively. In the short term, though, psychological areas like $550 to the upside and $500 below are likely to be more important, while zones from moving averages below are also in view.
Technical indicators on NVDA H4
Moving averages give a fairly strong buy signal, with all three of the 50, 100 and 200 SMAs below the price. However, the 50 SMA remains below the 100 – the value area between these two might be an important support in the runup to Christmas.
There is currently no sign of saturation from either Bollinger Bands (50, 0, 2) or the slow stochastic (15, 5, 5) although the latter at just over 74 is closer to overbought than neutral. Bands do indicate though that volatility has decreased significantly since early November, so a continuation of the current range seems to be possible over the next fortnight. This signal from Bands might typically be taken as suggesting the next significant directional movement for January.
Price action and Fibonacci
Failure to reach a new high yesterday above 12 November’s $550.18 suggests confirmation of the channel even though the gap up over the weekend is a positive signal. The lack of any fundamental movement and indeed any strong liquidity-driven movement since early November points to limited appetite to push higher in the near future.
The break below the 61.8% zone of the daily Fibonacci fan in late October wasn’t followed through with a serious retracement downward on higher timeframes, but it has led to the current phase of consolidation. This line might indicate the target area of the next high which could be projected for the new year somewhere around $630, depending of course on fundamentals and specifically Q4’s earnings.
Technical analysis of NVDA: summary
TA in general suggests ongoing consolidation for NVDA this month within its range over the last few weeks. While a Santa Rally and a retest of the latest highs on the four-hour chart are possible, this scenario is unfavourable unless clear new fundamental drivers appear.
Guest post by Exness.
Disclaimer: opinions are personal to the author and do not reflect the opinions of Exness or AskTraders.