
- The first half of the year has been one for the record books – Q1’s record-breaking crash and Q2’s equally remarkable recovery have occurred in a time-frame so short it surprised many in the market.
- Prices are currently trading within relatively tight ranges.
- There are plenty of reasons to watch and wait, but there are also stocks that look like good potential buys as they are positioned to benefit whichever way the market breaks.
As Q2 2020 drew to a close, stocks pushed through one final up day to post a market recovery that will go down in the record books. The Nasdaq Composite and Russell 2000 indices gained 1.9% and 1.4% on the day, marking a three-month surge of 30.6% and 25%, respectively.
Following the DJIA’s (Dow Jones Industrial Average) worst-ever Q1 ever (down 23.2%) the index posted its best second-quarter performance since 1938. Rallying by 17.8% through the quarter and not even letting up as it crossed the finishing line, posting a 0.8% rise on Tuesday. Equally strong was the S&P 500, which added 1.5% on Tuesday to end the quarter up by 20%. For this basket of stocks, it was the most significant quarterly gain since 1998.
 WELCOME BONUS - Free Share Bundle When You Invest £50!
Get up to £500 cashback for investing with IG.
WELCOME BONUS - Free Share Bundle When You Invest £50!
Get up to £500 cashback for investing with IG.
S&P 500 Index – Daily Candles – 7th February 2020–1st July 2020
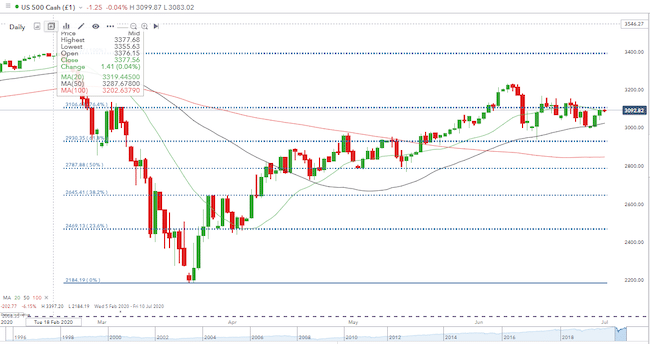
Most of the second quarter’s stock-market rally took place in April and May. The truth is that through June, the major indices have been trading in a relatively narrow range. For the S&P 500, that bunching has taken place around the 76.4% Fib retracement of the year’s big move. Is that price consolidation or a failure to breach an increasingly stiff resistance level? The global equity flagship index is representing in one chart the present pivot point of the markets.
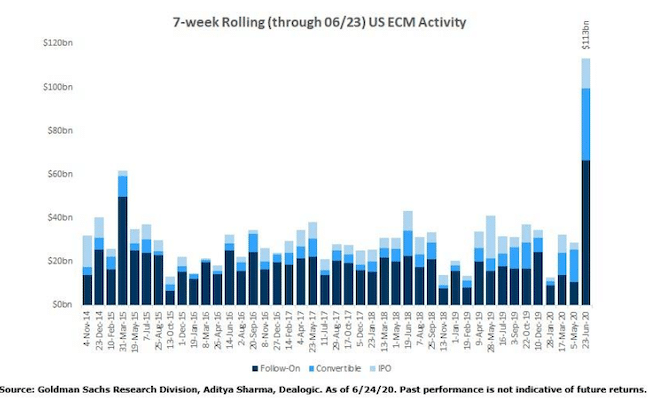
The big corporations in the US sold record amounts of stock in Q2. Data provided by Bloomberg shows secondary offerings in the US raised $113bn in the second quarter, the highest on record. That could be explained by firms strengthening their cash balances — a good thing. An alternative view was given by analysts at Zerohedge who wrote:
“When it comes to bearish market flow red flags, aggressive selling of stock by corporate insiders is traditionally viewed as the biggest red flag – after all nobody knows the prospects for their companies better than the people who run them”.
Source: Zerohedge
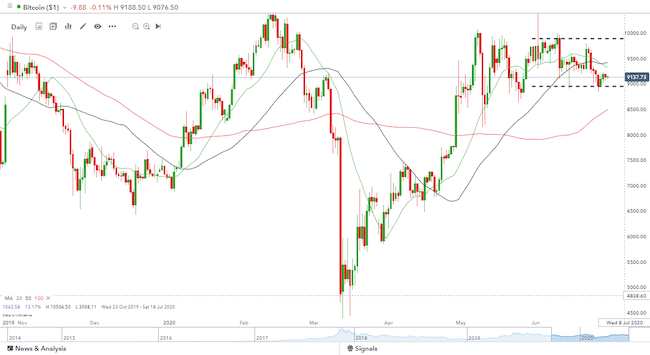
It’s not just equity investors who are weighing up increasing coronavirus cases against positive economic data. Bitcoin’s price volatility during June is marked by the dotted lines in the chart below, the closing prices through the month marking a tight range of $9,099–$9,781. There was one significant and failed attempt to break the $10,000 barrier but that fizzled out intra-day. Even Bitcoin is quiet.
Bitcoin – Daily Candles – 22nd October 2020–1st July 2020
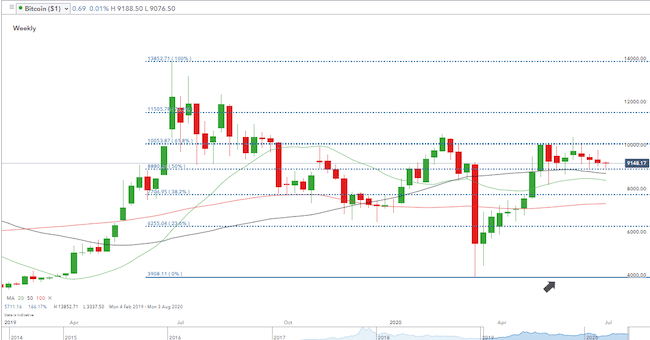
The weekly candle chart for Bitcoin shows the 61.8% Fib retracement sitting just above the $10k mark. The four candles for June looking like guests at a party which has just begun to lose its fizz.
Bitcoin – Weekly Candles – Feb 2019–1st July 2020
The question worrying all the asset markets is whether the risk of the virus persisting and data pointing to an improving economy can continue to run side by side. Viral hotspots were expected but there is as yet limited understanding of how to manage them and the risk of a second wave, particularly in the autumn. On the other hand, data keeps beating to the upside. On Tuesday, the US Conference Board reported an 11-point rise in the June consumer confidence index, to 98.1 points. That beat the forecast consensus and means American households remain more optimistic about the future than their current circumstances perhaps indicate. The present situation index component of the survey rose 15.1 points, to 86.2, while the expectations index rose 9.1 points, to 106. As data has the inherent problem of often being backwards-looking, such a ‘beat’ in a forward-looking report is a tonic for the bulls. However, identifying the next short-term trend will be hard to do until the situation becomes more apparent.
Fortunately, this week is data-heavy. The Federal Open Market Committee releases the minutes of its June monetary policy meeting on Tuesday afternoon. ADP also releases its National Employment Report for June on the same day. The Non-Farm payroll data is due on Thursday meaning analysts will have the US holiday on Friday to consider which way the market might move next.
This could be a time to factor into trading strategies, the market saying that some of the best trades you do are the ones you don’t do. Over-trading is one of the main reasons for retail traders eroding their profit margins. In the big investment houses and hedge funds, it’s perfectly acceptable to ‘sit on your hands’ and to take time to study instead of trade the situation.
Those looking to take positions may be considering scaling down position size. They can provide a marker for putting on a ‘proper’ size at a later date.
Enterprise Product Partners LP (NYSE:EPD)
The Enterprise Product Partners share price technicals and its fundamental prospects, make it a stock to watch. On Tuesday it recorded a market-beating one-day increase of 3.65%.
The dip in the EPP share price that started on the 8th of June could mark an entry point for those looking to gain exposure to a high-yield stock. The defensive aspects of a healthy dividend offering some protection to a broad market sell-off and a long position allowing investors to gain if the next move is a general market rally.
Enterprise Product Partners share price – Daily candles 14th Nov 2019–1st July 2020
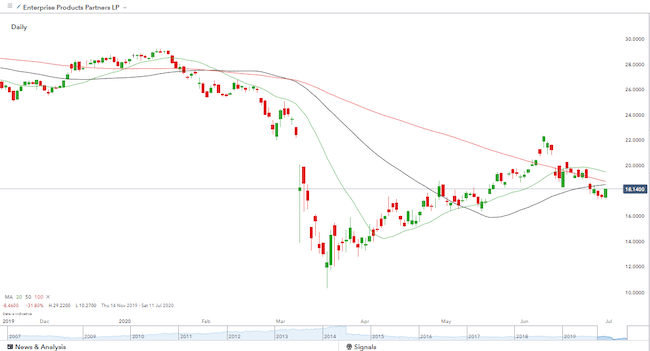
The EPP share price currently sits below the major daily SMA’s but the 50 is about to intersect the 100 SMA. A short-term move to above any of these averages would be technically bullish and support the firm’s strong fundamentals.
Enterprise Products Partners LP is an American midstream natural gas and crude oil pipeline company with its headquarters in Houston, Texas. Its focus on the US gas and oil sector may put some off, particularly following the news of fracking giant Chesapeake Energy (OTCMKTS:CHKAQ) filing for bankruptcy on Sunday.
That alarming event may be a catalyst for buying rather than selling EPP. Though the firms operate in the same area of the economy, picking through the bones of CHKAQ’s demise is throwing up signs of startlingly poor management.
“Fracking giant Chesapeake Energy’s bankruptcy filing comes following a financial mess at the company that included no budgets, a massive wine collection and a nine-figure bill for parking garages.”
Source: CNBC
The recent slide in the EPP share price means that if dividend payments stay in line, the yield on the stock will be close to 10%. This at a time when cash in the bank earns zero. Looking past the fact that the firm operates in the oil sector and is exposed to swings in crude prices reveals that investor reluctance to buy into the stock may be misplaced. The EPP share price has limited direct exposure to commodity prices as long-term fee-based contracts underpin 80% to 90% of its earnings.
EPP – Fundamentals
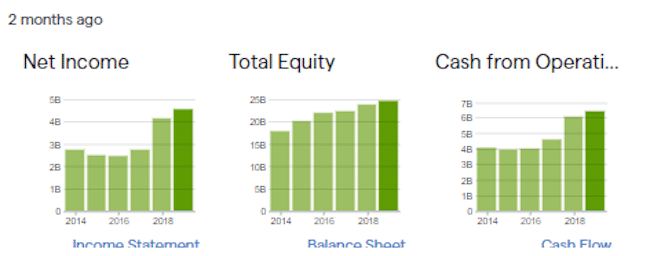
If a break to the upside follows the sideways market movement, EPP has a $1.1bn cash pile that offers protection if the break of the sideways market is to the downside. It also has the option to draw down on even more cash and has opted for a prudent approach and scaled back on current investment projects wherever it can. On top of that, the company has a strong credit rating of investment-grade and is backed by a conservative leverage ratio, which stood at 3.3 times debt-to-EBIDTA. If the break is to the upside, it could form a war-chest as opportunities arise to buy up cash-strapped rivals or to invest in organic growth.
EPP Broker Ratings
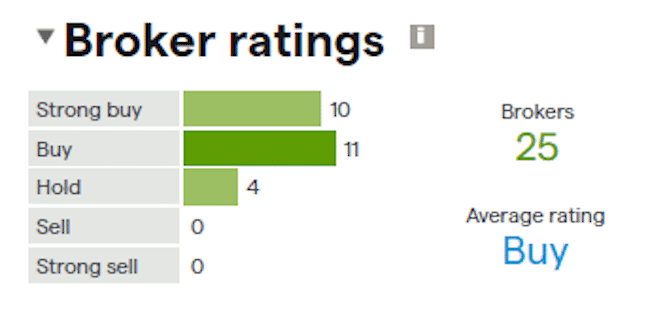
The Zacks equity research team are also fans. Their report of March still holds – a demonstration of why the stock may be one to buy even while the market is waiting for confirmation of its next move. In a report released by Nasdaq Zacks wrote:
“Enterprise Products is actually looking pretty good … The firm has seen solid earnings estimate revision activity over the past month, suggesting analysts are becoming a bit more bullish on the firm’s prospects in both the short and long term.”
Source: Nasdaq