
This is how harmonic trading patterns were born. They represent a rigid and clearly-defined structure that aims to generate a buy/sell signal.
In this guide, you’ll learn:
- What are the harmonic pattern and how they are best applied
- How to recognize key harmonic formations
- Learn to correctly draw a structure of harmonic patterns
- How to trade harmonic formations
What are Harmonic Patterns?
Harmonic patterns are geometric structures based on Fibonacci numbers. Each element of a structure is based on the specific Fibonacci level. As such, the entire structure captures the most recent price action with a goal of forecasting future price movements.
Harmonic patterns are mostly used on higher time frames and are more difficult to be identified by day traders and scalpers. Hence, harmonics are mostly used by long term and swing traders focused on position trading.
They also take a longer period of time to play out given the list of steps that have to be completed. The best time frames for harmonics trading are daily and weekly charts.
Harmonic patterns trading method is largely associated with the work of H.M. Gartley, who discussed harmonics in his book titled “Profits in the Stock Market (1932)”. As a result, the most commonly used harmonic pattern is named after him.
More recently, Scott M. Carney discussed structured patterns based on Fibonacci ratios in his book named “The Harmonic Trader (1999)”. Scott Carney is seen as someone who revitalized the harmonic trading approach.

Relation to Fibonacci Levels
Harmonics are completely designed on Fibonacci ratios. According to the theory of Fibonacci,
each number after 0 and 1 represents a total of the two previous numbers.
By applying this method we come to the following sequence: 0, 1, 1, 2, 3, 5, 8, 13, 21, 34, 55, 89 and so on. This writing piece also introduced Hindu-Arabic numbers to Europe for the very first time to replace Roman numerals.
Ultimately, each number is roughly 61.8% of the next number, and then around 38.2% of the following number etc. This way we come to Fibonacci retracement lines – 23.6%, 38.2%, 50%, 61.8%, 78.6% and 88.6%.
Harmonic patterns also utilize key Fibonacci extension levels e.g. 127.2%, 161.8% and 261.8%.
List of Harmonic Patterns
Here, we present a list of 6 most commonly used harmonic patterns. Each of these patterns has its bullish and bearish versions as they produce a buy and sell signal respectively. Try learning more about each and one of them before identifying the best harmonic pattern for your trading style.
Every pattern starts with the XA move that initiates a trend. The XA leg, in the bearish version of a harmonic pattern, is a move lower. The opposite scenario applies to bullish patterns.
ABCD Pattern
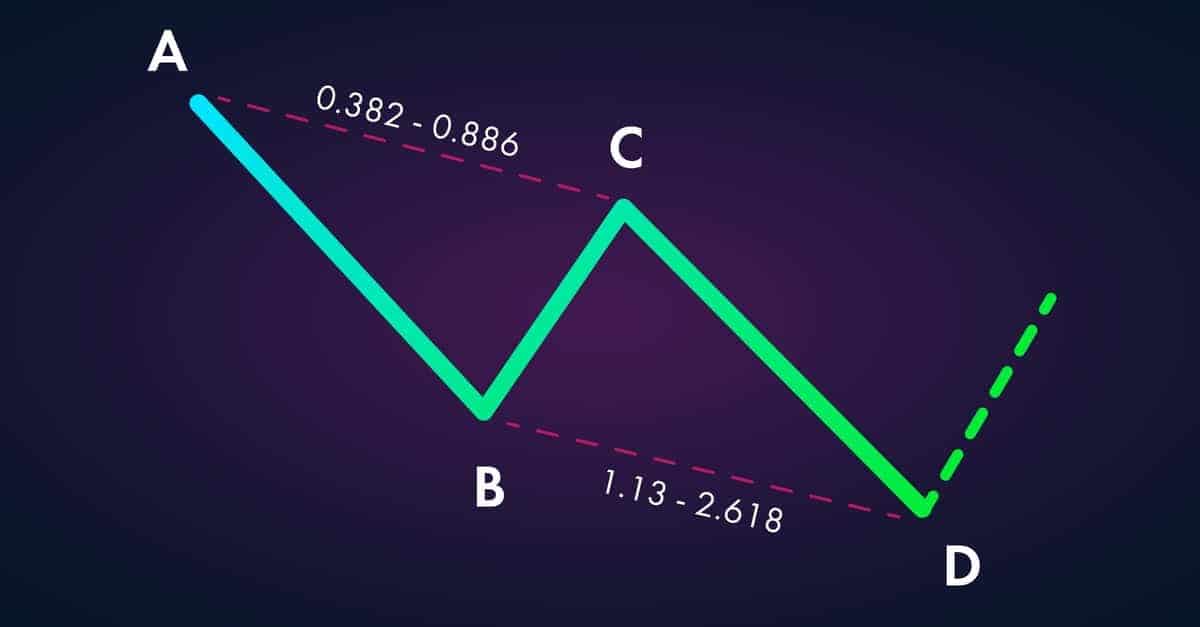
The ABCD pattern, alongside Gartley, is arguably the most widely used harmonic pattern. Many traders learn to trade the ABCD formation first as it provides a solid base to learn other, more complicated, patterns. It is also called “AB=CD pattern” as AB and CD moves are equal legs, while the BC move represents a correction.
The ABCD pattern is based on the three following guidelines:
- AB is the starting move;
- BC should represent 61.8% retracement of the AB move;
- CD should represent a 127.2% extension of the BC correction.
The illustration above demonstrates what a regular bullish ABCD should look like. All these steps are done to identify point D, where the buy signal is generated. The bearish version of ABCD follows the same guidelines except that AB is a move in the opposite direction that ultimately generates a buy signal at point D. This point indicates a potential reversal zone.
Useful Pages:
Compare Stock Brokers | Compare Forex Brokers | Compare CFD Brokers
Gartley Pattern
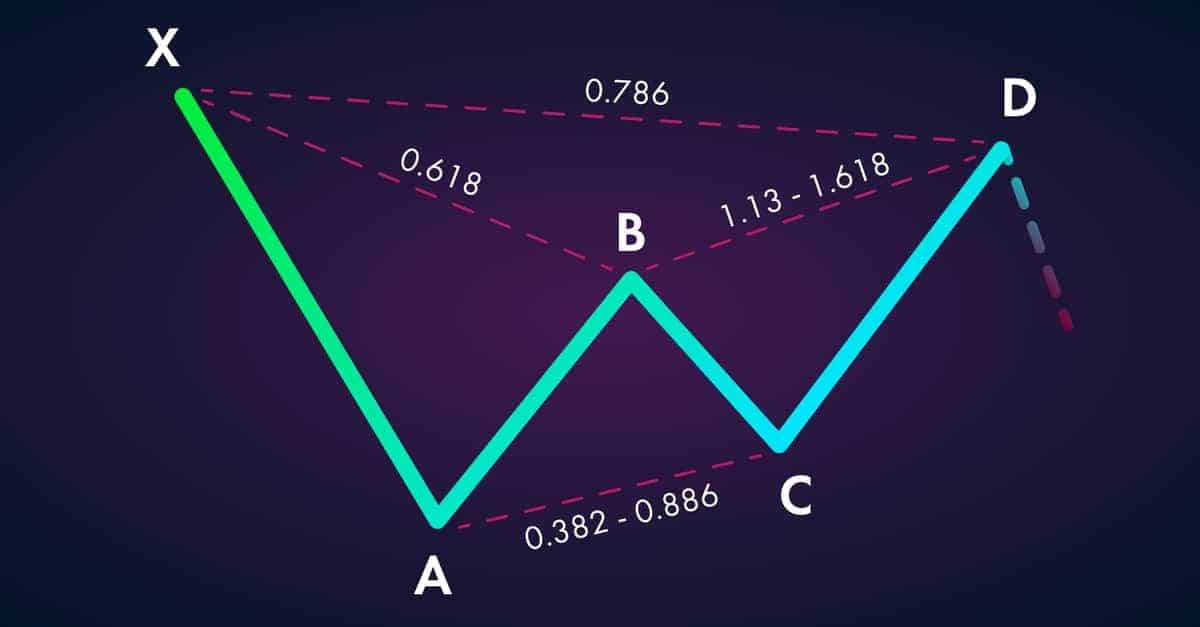
Gartley is designed by following these requirements:
- XA – This is where the pattern starts;
- AB – The point B should end at the 61.8% Fibonacci retracement of XA;
- BC – The BC move should end at either the 38.2% Fibonacci level, or 88.6% Fibonacci of the prior leg;
- CD – If BC ends at 38.2%, the CD should extend to 127.2%. Otherwise, the point D comes at the 161.8% extension of BC;
- XD – Moreover, the point D should be 78.6% retracement of the initial XA leg.
The Crab Pattern
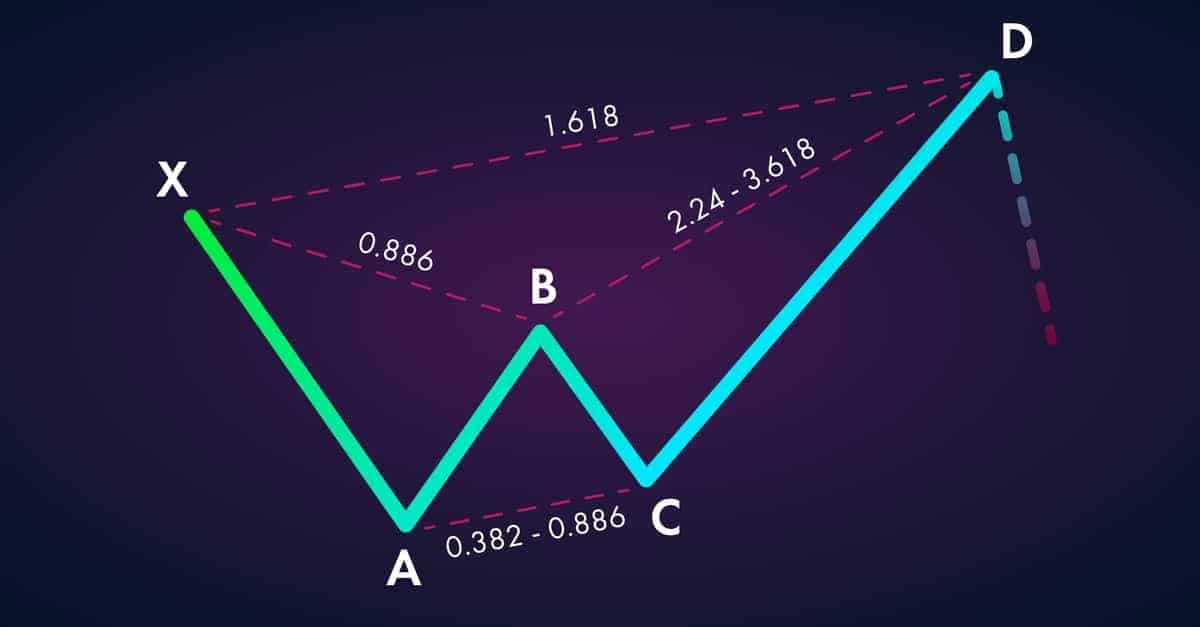
This is how you draw the Crab pattern:
- XA – The first leg that initiates a trend;
- AB – This leg should be either 38.2% or 61.8% Fibonacci retracement of XA;
- BC – This move takes place in the opposite direction of the AB move, correcting to either 38.2% or 0.886% of AB;
- CD – If the BC leg is 38.2%, then CD should reach a 224% extension mark. On the other hand, if BC ends at 88.6%, then CD should be 361.80% of BC;
- XD – Ultimately, the buy signal at the point D is approximately at 161.8% Fibonacci extension of the initial XA leg.
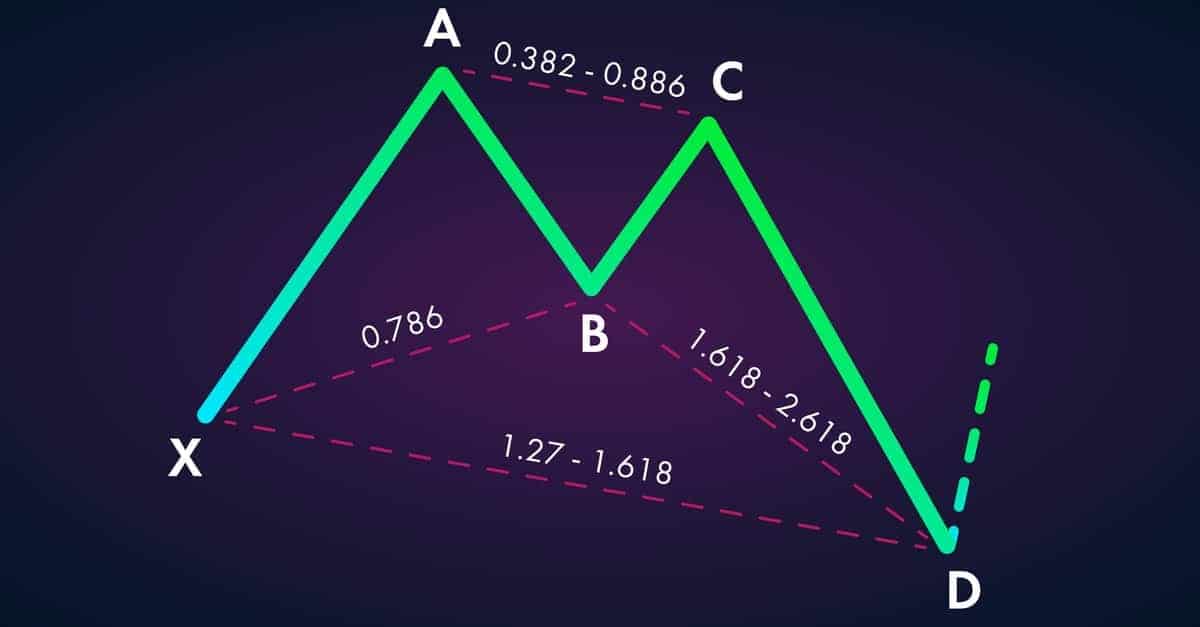
The Bat Pattern
The Bat pattern is designed by following these steps:
- XA – A leg that starts the trend;
- AB – It should end between 38.2% and 50%;
- BC – This leg is either 38.2% or 88.6% of the AB move;
- CD – If the BC is 38.2% then the CD should reach a 161.8% extension. In the opposite scenario, the extension should come to 261.8% if the prior leg retraced 88.6%;
- XD – The entry point for a trade (D) is ideally located at the 88.6% Fibonacci retracement of the starting XA leg.
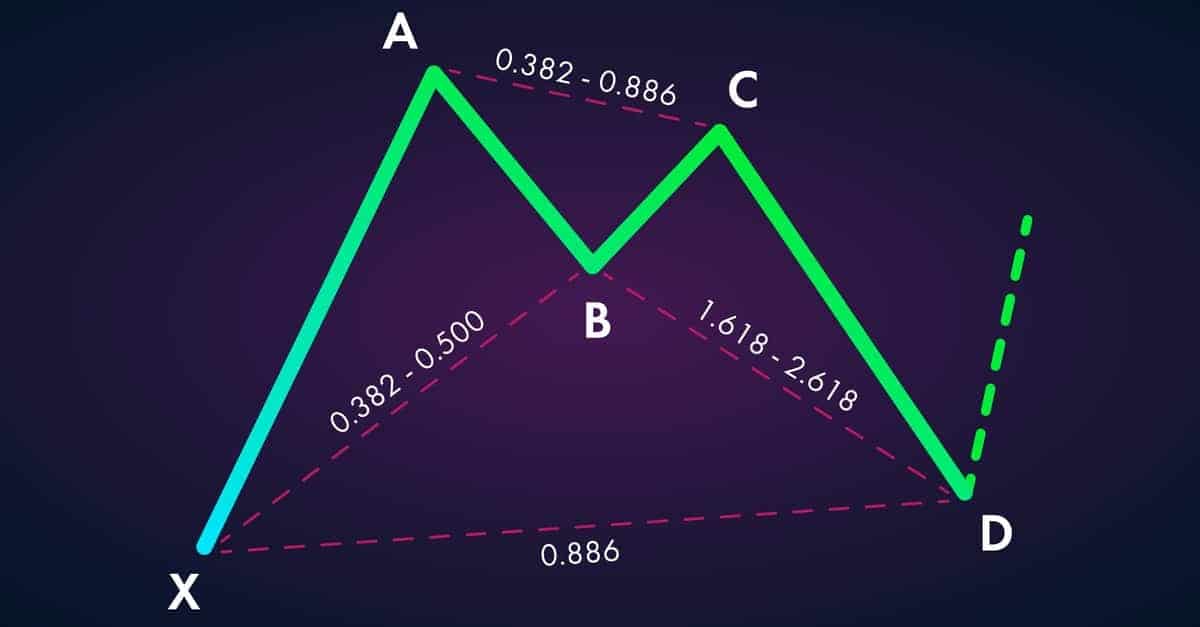
The Butterfly Pattern
This is how you draw the Butterfly pattern:
- XA – A starting leg that initiates a trend;
- AB – The price action should retrace to 78.6% of the XA leg;
- BC – This leg is again either 38.2% or 88.6% retracement of AB;
- CD – Exactly the same as in the batter pattern. If the BC leg ends at 38.2%, then the CD leg should reach a 161.8% extension. If the BC leg ends at 88.6%, the point D extends to 261.8%;
- XD – Due to a bigger correction in the AB leg, the point D in a Butterfly pattern should be at 127% or 161.80% Fibonacci extension of the starting XA leg.
The Shark Pattern
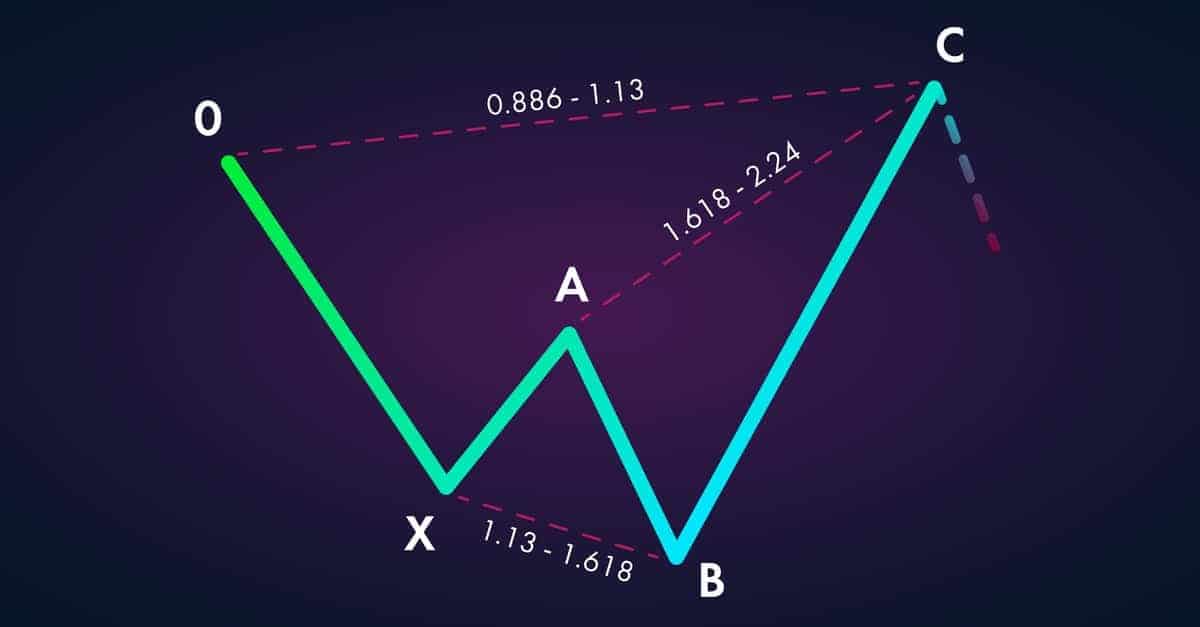
The Shark pattern is a relatively new harmonic pattern. This is how you generate trade signals with the shark pattern:
- XA – The starting move of the pattern;
- AB – This leg should end between 113% and 161.8%;
- BC – Depending on the AB extension, this leg should be 161.8% or 224% extension of the prior move. This is a final step as point D is a buy/sell signal.
The Cypher Pattern
- The Cypher pattern is designed by following these steps:
- XA – The first leg that puts the pattern in motion;
- AB – This leg ends at 38.2% or 61.8% of the starting move;
- BC – This leg uses unorthodox Fibonacci extensions of 113.0% (if AB 38.2%) and 141.4% (if AB 61.8%);
- XA – In this pattern, the final D point should correspond to 78.6% Fibonacci retracement of the initial XA move.
Advantages and Disadvantages
Arguably the biggest advantage of harmonic patterns is a clearly-defined structure. This base equips traders with direct entry and exit points. Hence, traders don’t need to interpret signals using different methods. If you are following the harmonics, you simply have to take the signal once it is generated.
The structure also helps us with risk management. A clearly-defined price level gives us the entry point, as well as take profit and stop loss orders that are usually very attractive.
However, exactly this rigidness in structure is what makes harmonic extremely rare. Even if a trader identifies points A and B, for instance, point C may not come as expected and everything falls down.
Therefore, much patience is needed to identify, draw, and ultimately trade harmonics. Moreover, harmonic formations are one of the most complex patterns as far as the identification phase is concerned. For this reason, they are seen as an advanced trading method used by more experienced traders.
How to Draw and Trade Harmonic Patterns
Drawing harmonic patterns requires a strict following of the guidelines and harmonic ratios. This is because each step is somewhat dependent on the precision of the prior step. Therefore, it is important that you follow the guidelines step-by-step to verify the legitimacy of the given harmonic.
Many trading platforms, such as TradingView and other software programs, have in-built features for drawing harmonic patterns. Therefore, your job is much easier as you only have to follow the guidelines and connect the dots on a chart.
Before we share tips on how to draw and trade harmonic, it is important to note that it’s almost impossible to identify a perfect pattern. Certain legs will extend higher or come in lower than they should be, but as long as the rough structure of the harmonics is respected – it’s fine.
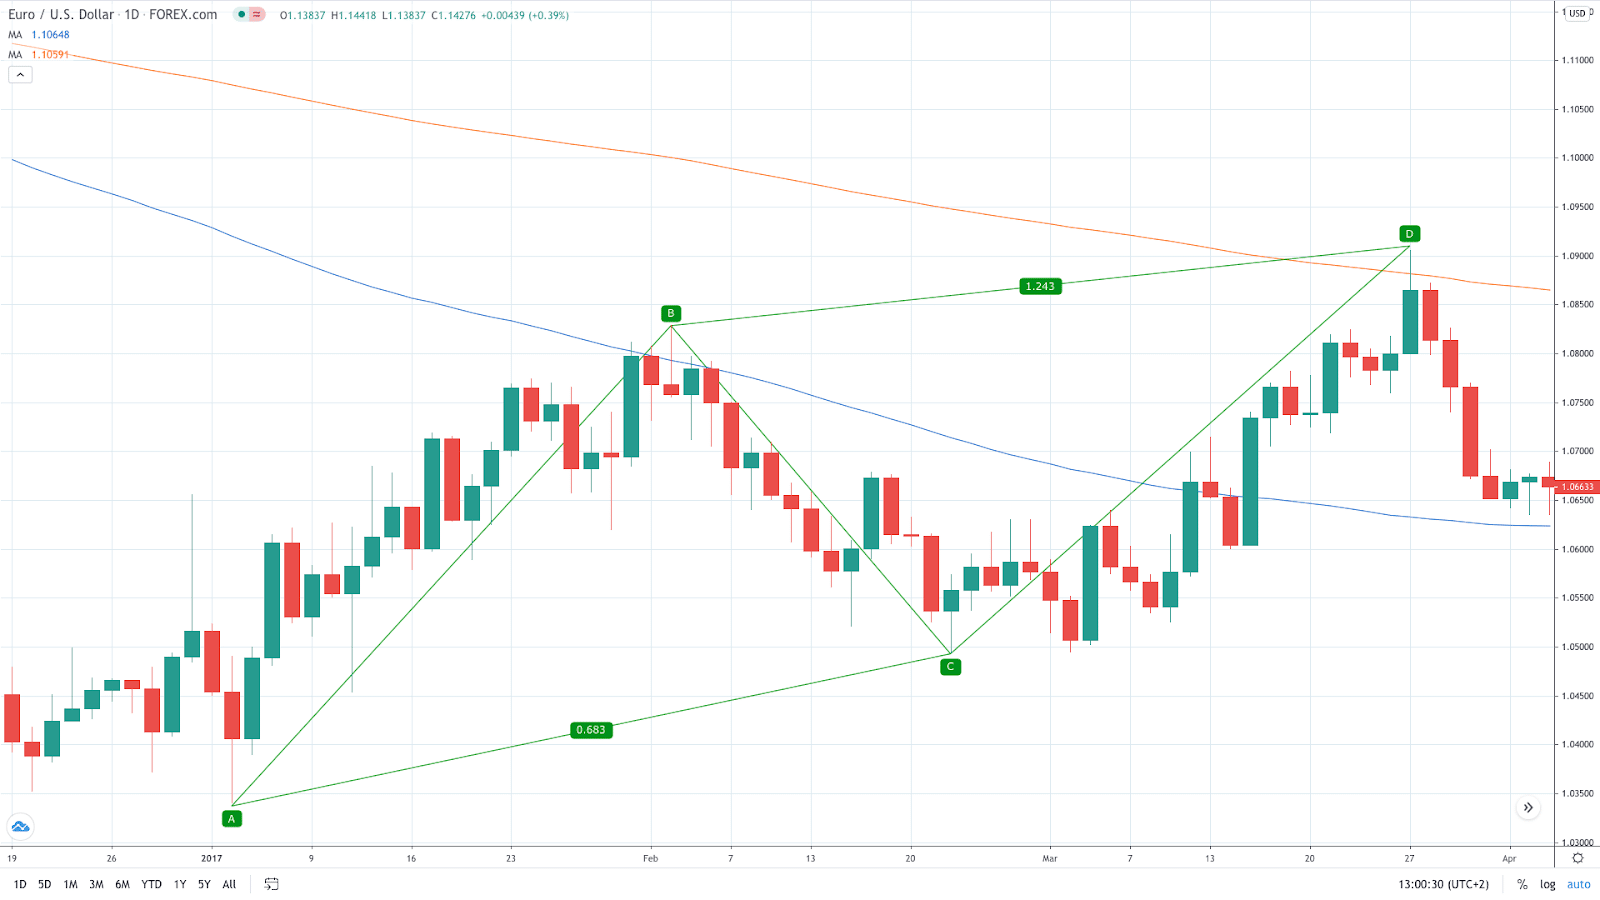
The easiest way to draw a harmonic pattern is to go step-by-step. Complete the first step (if possible) and move on to the next one. If the structure can replicate the guidelines, the final point C or D should generate you a buy or sell signal.
In the EUR/USD daily chart, we see the pair moving higher. As stated earlier, AB and CD are equal legs, with the BC moving in the opposite direction. In this case, the structure is quite precise except for a bigger-than-expected retracement in the BC (around 70%).
Once all points are connected, we move to implement a harmonic Forex trading strategy. For those looking to play it safe, more successful traders still cross-check the generated signal with other technical analysis tools e.g. pivot points, moving average, support and resistance, etc.
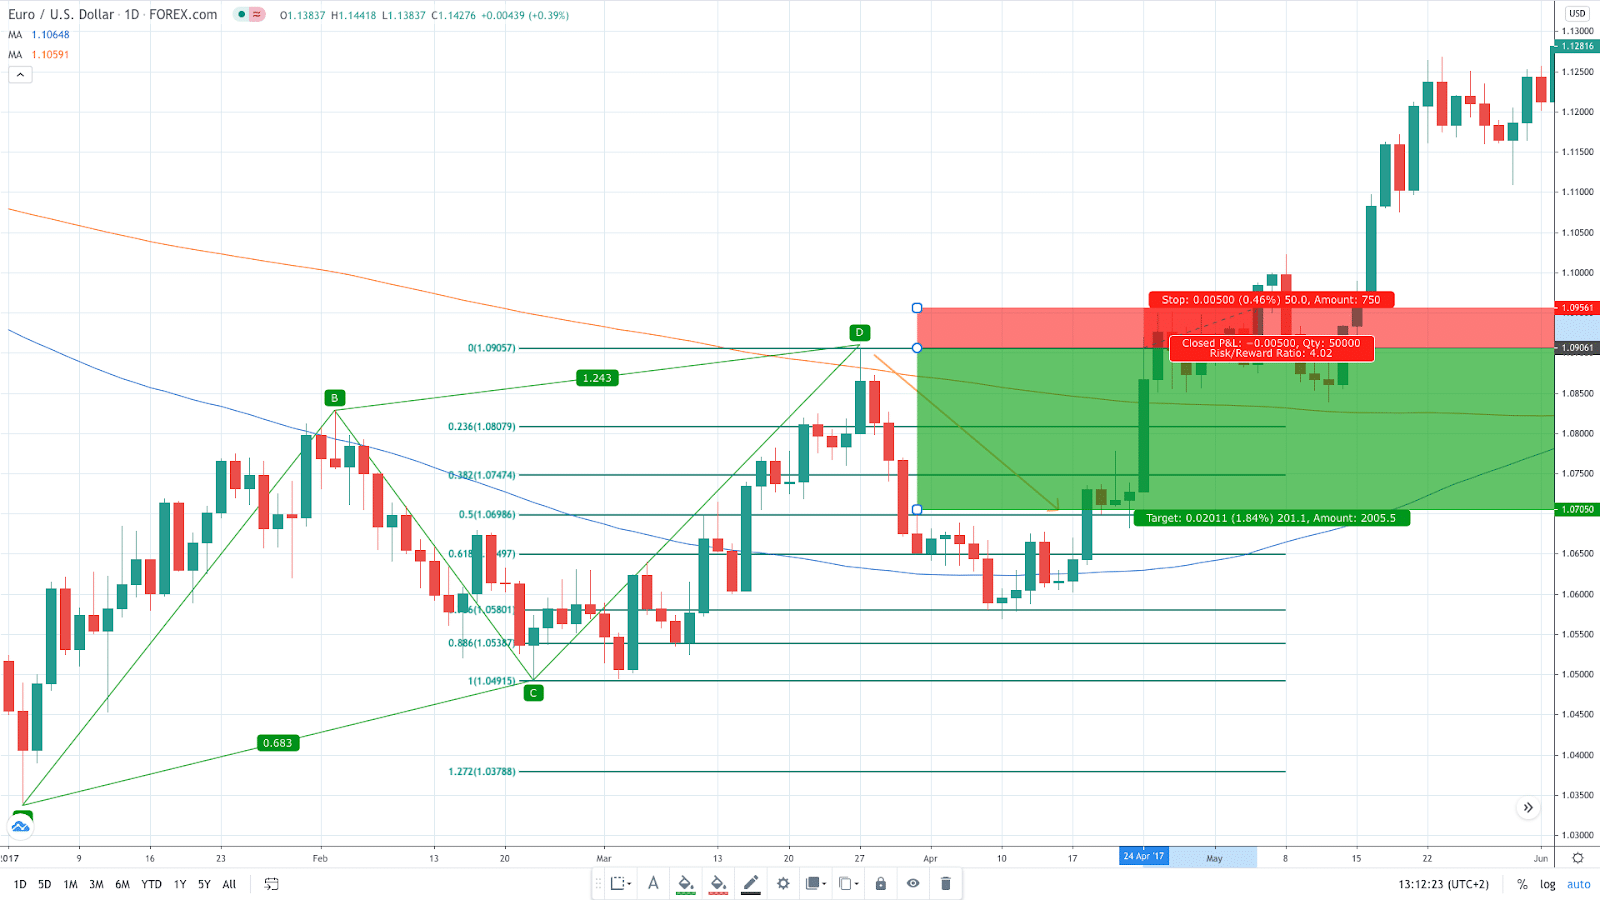
In this case, the point D generates a sell signal at $1.09. The placement of a stop loss order depends on your risk sentiment. Here, we put it 50 pips above the entry to allow for the price action to extend a bit further to the north.
The take profit order is calculated by using the last CD leg and the Fibonacci measurement techniques. Again, depending on your risk management and trading style, you set the desired target. In general, experienced traders look for a retracement between 38.2% to 61.8%. We are using a 50% retracement level as this is also where the horizontal support is located.
All in all, we are opening a sell position at $1.09, stop loss is at $1.0950 and looking to collect our profits around $1.07. Ultimately, the price movements head lower to hit our target and collect us 200 pips.
Summary
- Harmonic patterns are geometric harmonic chart patterns based on Fibonacci numbers.
- The most popular harmonic patterns are ABCD, Gartley, Bat pattern, Butterfly pattern, Cypher pattern, Crab pattern and the Shark pattern.
- The greeted advantage of harmonic patterns is a specific price structure that generates a buy or sell signal
- Its limitation is that the rigid structure is difficult to identify and not so common
- The risk-reward ratio offered in harmonic patterns is usually very attractive.
PEOPLE WHO READ THIS ALSO VIEWED:


