
The Butterfly pattern is a 5-point harmonic pattern that was first introduced by Bryce Gilmore and further defined by Scott Carney. Like the Gartley pattern, the Butterfly pattern uses Fibonacci measurements to define each point that arises after the initial impulse wave XA. Additionally, the last point in the structure, point D, is not a point, but instead, a zone called a potential reversal zone (PRZ). The main difference between the Gartley pattern and the Butterfly pattern is the Fibonacci retracements and extension that are used to define each point or zone.
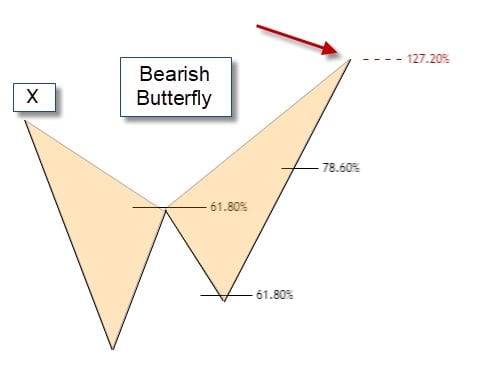
The Butterfly pattern is used as a reversal pattern that is geared to pick tops and bottoms. The setup and completion of the pattern are generally at tops and bottoms. The formation of a Butterfly top looks like and “M” where the formation of a bullish Butterfly pattern looks like a “W”.
The Butterfly pattern can be either bullish or bearish. The 5-points are:
- XA Impulse Leg
- AB is a 78.6% retracement of XA
- BC Leg is a 1.27% projection of XA
- CD which equals AB or is a 1.27% extension of AB
- Target1 = 38.2% retracement of AD
- Target2 = 61.8% of AD
- Common Risk Management stop loss just above or below point X
The swing from A to D should be a 127.2% or 161.8% extension of the XA line
As with most of the harmonic patterns, the movement from point A to point D a valid ABCD pattern must be observed.
Additionally, a strong setup of the Butterfly pattern should create two triangles (XAB and BCD) that should be almost equal in terms of time that it takes to complete the triangles. If not look for the second triangle (BCD) to be between 61.8% and 161.8% of the first triangle (XAB). A continuation of a move beyond 161.8% would suggest that the bullish pattern is broken, and bearish movement may be inevitable.
The risk management on a bearish or bullish Butterfly is different from the risk management on other harmonic patterns. Here you would attempt to put a stop loss level above the sales point but the high is higher than the beginning of the impulse move. You could use other highs or a percentage loss level to determine the appropriate stop loss level.
Fibonacci Expansion and Projection
Following the move XA, there is a retracement made to form AB. That provides the point where there can be a projection BC which is equal to XA. For an expansion, from the move XA, a retracement is made to form point B, to form AB. A projection is plotted from point A, which is equal to XA to form AC.
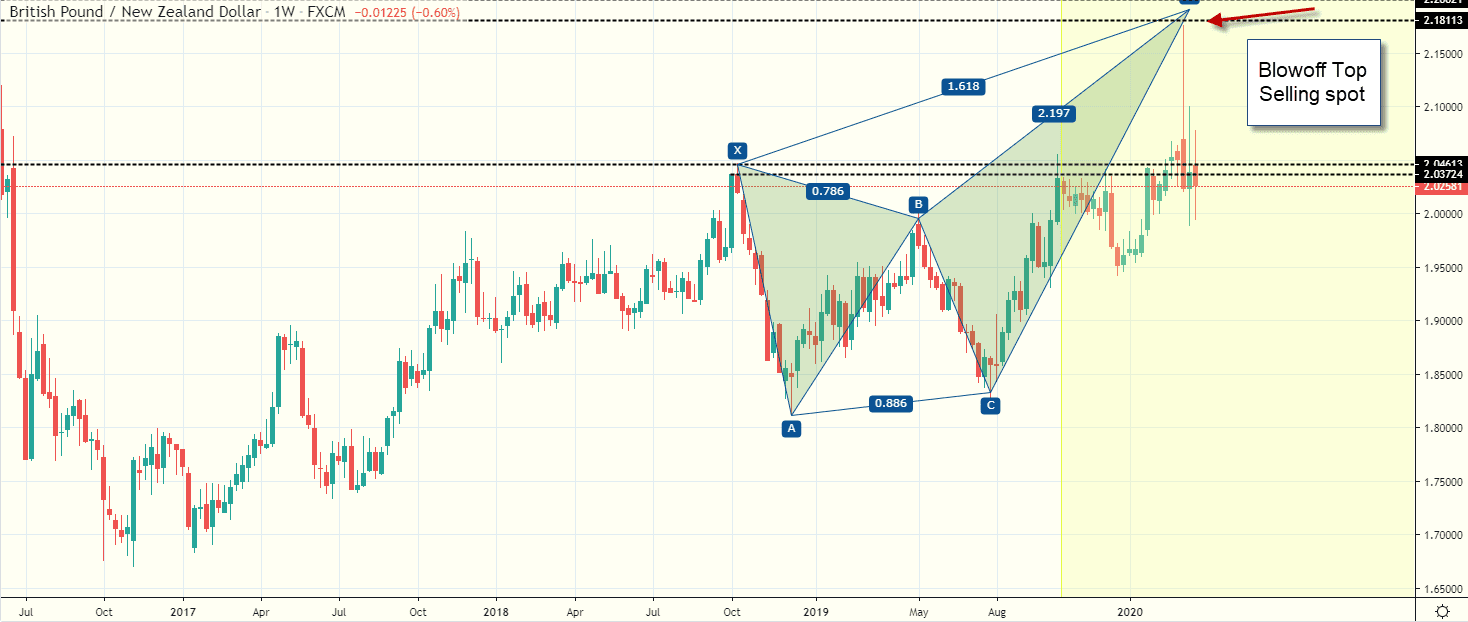
The chart of GBP/NZD shows a bearish butterfly pattern where the exchange rate surged to the projected sales spot in a blowoff move that would allow you to short the market at the top of the move where the harmonic Butterfly pattern projected the exchange rate to complete is expansion.
Risk Management
The Butterfly Patterns provides you with a range where you might consider purchasing or selling an asset. The Butterfly pattern requires additional resources such as prices outside their pattern to formulate your risk management plan.
You can consider using other technical indicators in conjunction with Butterfly patterns. Overbought and oversold indicators such as the relative strength index and stochastics might be patterns that help you determine if the setup creates an entry point that fits your trading style.
Key Take Away
The Bullish and Bearish Butterfly patterns are 5-point patterns. Each of a basic ABC pattern that is preceded by an impulse wave XA. Butterfly patterns are geared to picking highs and lows. After the setup is created, a potential reversal zone (PRZ), point D is generated as a target range that can be a buying point and a selling point. You want to have a prudent risk management plan where you stop loss level is above your entry point using price points that are outside the Butterfly pattern or a percentage loss level.
PEOPLE WHO READ THIS ALSO VIEWED:


