How to Use Pivot Points to Trade
Pivot point trading involves looking at the position of the current market price, relative to price levels established for the asset during the prior session. If market prices are trading above pivot point levels, the outlook for sentiment is bullish (positive) and traders are likely to target the next level of resistance. If market prices are trading below pivot point levels, the outlook is bearish (negative) and traders are likely to target the next level of support to the downside.
In practice, pivot points appear on a price chart as a series of horizontal lines (indicating potential support and resistance levels). In most cases, trading stations will plot these points using the following designations:
- R3 – Third Resistance
- R2 – Second Resistance
- R1 – First Resistance
- Pivot Point
- S1 – First Support
- S2 – Second Support
- S3 – Third Support
In the list above, the Pivot Point represents the base price point, which is plotted in the middle of the price chart. Resistance 1 marks the first pivot point above the base pivot. Resistance 2 marks the second pivot point above the base pivot and it rests above R1. Resistance 3 marks the third pivot point above the base pivot and it rests above R2.
Support 1 marks the first pivot point below the base pivot and a bearish outlook can be established if this level is broken to the downside. Support 2 marks the second pivot point below the base pivot and it rests below the first support level at S1. Support 3 mars the third pivot point below the base pivot and it rests below S2. When all of these pivot points are plotted on a price chart, there will be seven total pivot levels with five parallel lines plotted horizontally on the chart.
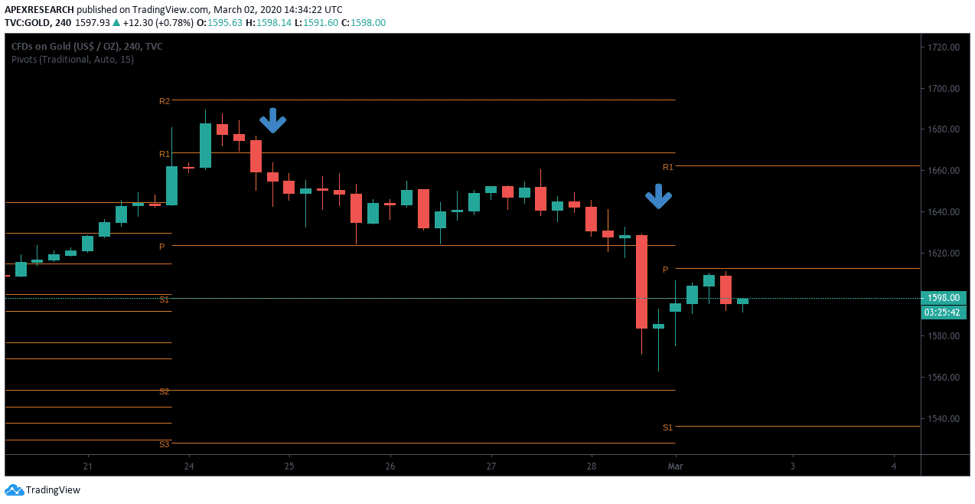
In the chart example shown above, a bearish condition is present as market prices break pivot point support zones on two separate occasions. As we can see, when the market trades through pivot points, it becomes easier to assess the likely direction of sentiment during the following market sessions. In the chart example above, it shouldn’t be surprising to see that bearish price activity follows each downside break through pivot point support levels. These are bearish events and they would lead expert traders to initiate short (negative) trading positions for the asset.
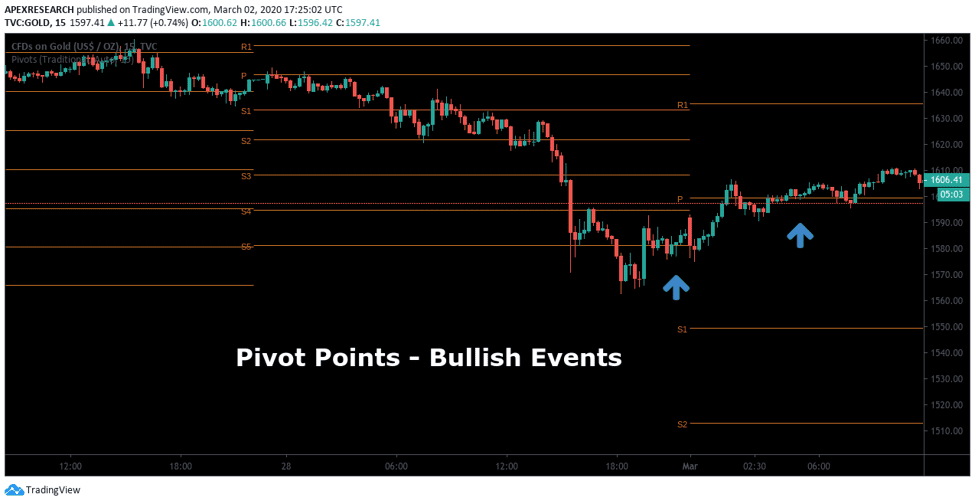
In the next chart example shown above, we can see a series of consecutive bullish events that unfold at various pivot points that were established previously by the indicator. Overall, pivot points work as the basis for sentiment in the indicator reading and this helps determine trend direction for new positions. However, the indicator will also help traders identify upcoming support levels. This can be useful information whenever traders are looking for places to set a stop-loss order for a position.
Pivot Point Types
For active traders, there are five different types of pivot points that are commonly used. Each of these different pivot point strategy techniques will provide a slightly different take on the established concepts:
- Standard Pivot Points are also referred to as Classical Pivot Points or Floor Pivots. These trading terms are often used in interchangeable ways but the main idea traders must remember is these are the pivot points that are plotted in most trading stations.
- Woodies Pivot Points employ calculations that are quite different relative to standard formulas for pivot points. Woodies use a formula that places additional weight on the market’s closing prices. In this case, pivot point calculations multiply closing prices by a factor of 2x and adding the High/Low for the period. This number is divided by a factor of 4x to arrive at the pivot point price levels.
- Camarilla Pivot Points were introduced by Nicolas Scott in the 1980s. Camarilla pivot points are similar to Woodies because they use closing prices from the prior day in order to compute support/resistance levels. Instead of using three levels, the Camarilla pivot points are based on a system of four support levels and four resistance levels. This means that the system is based on a total of nine price levels.
- Fibonacci Pivot Points involve the use of Fibonacci studies (projections, extensions, and retracements). Some of the most common Fibonacci numbers watched by traders include the 38.2%, 50%, 61.8%, and 100% Fibonacci retracement levels. These levels are often plotted as horizontal pivot points and can be used in active trading.
- Demark Pivot Points were designed by renowned trader Tom Demark, who is famous for his innovative technical analyst trading techniques. Demark’s Pivot Points are different from most others because they are conditional in nature (with an outcome that is based upon relationships between closing prices and opening prices).
While this list of different pivot point techniques might look intimidating, it should be understood that the basic ideas and concepts that underlie pivot points remain largely the same. Horizontal lines in the pivots indicate breaks of support or resistance. The direction of the break works as a primary indicator of sentiment and trading positions can be established based on these events.
Pivot Point Calculations
Standard Pivot Points use calculations that take the sum of the price high, the price low, and the closing price for a given time period. This total sum is then divided by a factor of three and this figure forms the basis of the pivot point indicator readings. Similarly, Woodies Pivot Points calculations allow traders to plot two pivot support and resistance levels based on a central pivot which places the system’s first resistance level at a price point 2x the Pivot Point,less the value of the price lows. Finally, the price boundary that results is plotted using the sum of the Pivot Point is calculated as the difference between the price high and price low of the charting period.
Camarilla Pivot Points calculations are based on four levels of price resistance and four levels of price support. Remember, this is in contrast to the Standard Pivot Point system, which is based on just two price levels for resistance and two for pivot support. Fibonacci Pivot Points calculations make use of primary price levels in Fibonacci pivot formulas that are typically associated with the Fibonacci numbers at the 38.2% and 61.8% retracement levels. DeMark Pivot Points offer a unique take on the traditional concepts of pivot point for swing trading was based on decades of active trading and analysis of historical backtesting studies. Demark Pivot Points are also conditional in nature because they are based on differential relationships that exist between the opening market price of an asset and the closing price of an asset.
Pivot Point Trading Strategies
As we illustrated in the first chart examples, pivot points can be used to initiate trades in both the bullish and bearish directions. This means that traders can profit during rising and falling markets because pivot points offer traders access to a simple set of investment tools that can be used to identify dominant trends in a wide range of financial markets. Trading strategies that employ a unique approach to pivot points are often able to maximize gains while limiting the potential for losses with the use of stop-loss orders.

What Can You Trade with Pivot Points?
Forex is the largest trading market in the world, allowing investors to speculate on the value of different currencies around the globe. On any given trading day, the average turnover rate is over $5 trillion and investors are able to access these markets at any time because the forex market never really closes. For more details check our article on how to use pivot points when trading forex.
Stock Indices allow traders to access popular stock benchmarks that follow some of the largest publicly-traded companies in the world. Stock indices offer exposure to the world’s top financial markets with relatively low levels of market volatility.
Individual Stock Shares Buy and sell top companies such as Barclays, Amazon, Tesla and more with low commissions. Tap into shares without stock-specific risks Spreads from 1 pt on UK shares Go long or short on global companies MORE SHARES
Commodities Markets allow investors to trade metals, soft commodities, or energy assets in the form of a Contract for Difference (or CFD). Essentially, this allows investors to capture all of the gains in market prices without the obligation of holding the underlying asset. Commodities traders are often able to take advantage of low trading commissions.
Cryptocurrency assets have rapidly grown in popularity during the last several years and traders are able to hold both long and short positions using a virtual wallet or other trading platforms. Cryptocurrency traders are often able to benefit from added leverage so that traders can maximize gains while using limited levels of market capitalization.
Key Points: Trader Summary
- If market prices are trading above a system’s pivot point, the bullish event indicates the day is likely to be positive (upward price movements).
- If market prices are trading below a system’s pivot point, the bearish event indicates the day is likely to be negative (downward price movements).
- Pivot Point trading systems will typically include four levels that surround the pivot zone: Support 1 (S1), Support 2 (S2), Resistance 1 (R1), and Resistance 2 (R2).
- However, some systems change the number of support and resistance levels that surround the Pivot Point so traders must understand which system is being employed at all times.
Price levels that move above or below support/resistance levels may trigger market reversals. However, these events can also be used when may confirming trend activity. For instance, when market prices fall below Support 1 (S1), traders


