For technical traders, candlestick pattern identification is an essential tool. Trading using technical analysis involves the use of the Japanese candlestick charts more often than not, and common pattern recognition can be a valued addition to your trading arsenal.
YOUR CAPITAL IS AT RISK
In this guide, we will be covering:
Table of contents
What is a Candlestick Chart?
A candlestick chart is a visual way of displaying the price movements of financial instruments such as derivatives, securities or currency. It shows an asset’s price movement of a set period of time. These intervals can be anywhere from 1 minute to a month depending on the individual trader’s preferences.
Each candle presents a visually appealing and easy to understand overview of an asset’s price action. Candlestick charts allow traders to instantly see price highs and lows and easily spot patterns that allow them to make informed short-term trading decisions based on the direction of the price.
How to Read Candlestick Charts
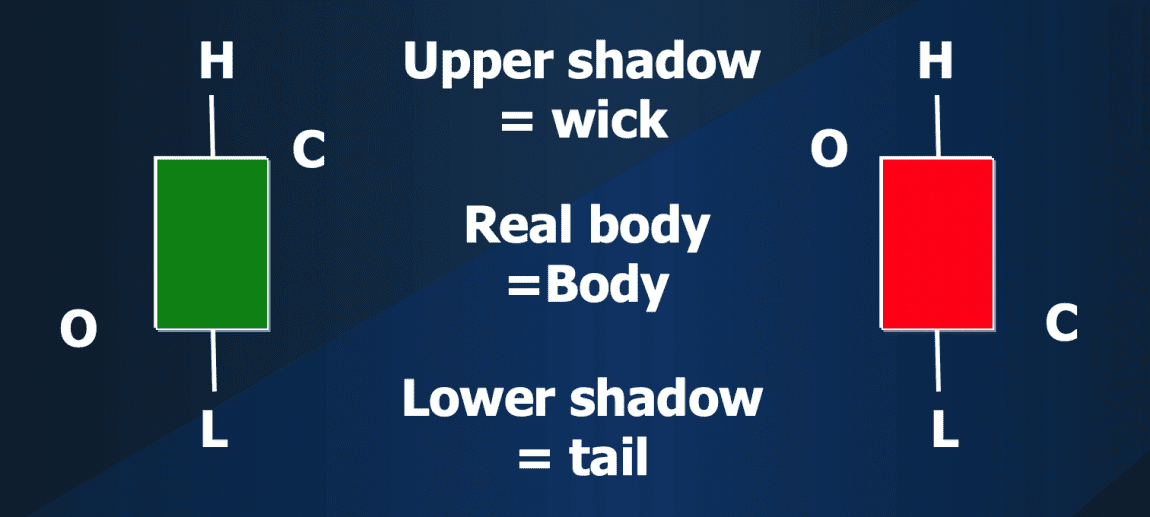
A typical candlestick chart looks similar to a bar graph or Open High Low Close (OHLC) chart. It displays a market’s:
- Close price
- Low price
- Open price
- High price
Interpreting candles and candlestick charting is similar to playing chess in some ways.
A beginner in chess will look at each individual chess piece and what its position is telling the player about the future movement of the opposition.
A grand master will look at the whole picture and draw a conclusion as to the likely moves of the opposition and the outcome of the game. The chess grandmaster started out as a beginner and had to learn the basics of the game just as a new trader must learn the individual candlesticks.
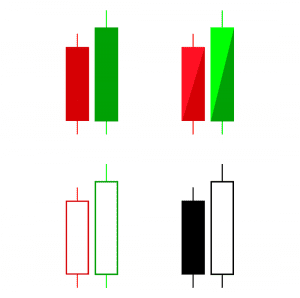
Candle Colours
Each candlestick has wide parts referred to as the ‘real body’, which shows you the range of open and close prices for the day. Candles can be either ‘bullish’ or ‘bearish’.
- Bullish (Green or White): The open price is lower than the close price
- Bearish (Red or Black): The closing price is lower than the open price.
You will also see lines above and below the real body of the candle. These are referred to as shadows, with the shadow above the ‘real body’ called the ‘wicks’ and those below referred to as the ‘tails’. These shadows represent the lows and highs prices for the time period. So, in the case of a daily candlestick, for the day.
The relationship of the highs and lows – and the opening and closing prices – for the period being looked at will determine what your chart looks like. You will see both short and long ‘real bodies’, while ‘wicks’ and ‘tails’ can also be short or long. Together, these form the shapes of the candlesticks.
Candle shapes reflect both a shift in supply and demand and also the emotions and behaviours of traders. Candlesticks form different price patterns which can be either bullish or bearish. Bearish patterns indicate a price fall, while bullish ones indicate a rise. Although this sounds rather simple, these patterns do not guarantee success – they are only indicators.
Common Candlestick Chart Patterns
Let’s now take a look at some common candlestick patterns that every trader should know:
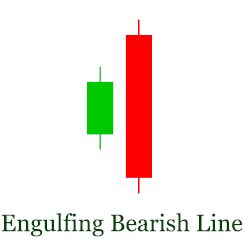
Bearish Engulfing
This bearish pattern happens during an uptrend. It’s represented by a long black or red body (negative) is engulfing a smaller real body from the previous candlestick. This indicates that sellers of a particular asset are taking control and usually translates to lower prices.
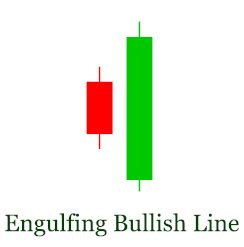
Bullish Engulfing
The pattern will show a long white or green (positive) body engulfing a small body from the previous candlestick. This pattern appears when buyers start taking control of the market and means that prices are more likely to then go higher.
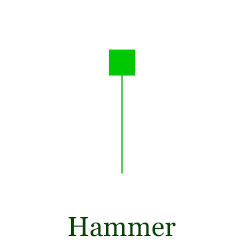
Hammer
A prior downtrend is required. The Hammer candle has a small real body, small upper shadow, and long lower shadow. This highlights a market that has dipped lower and then rebounded. It can signal a bullish reversal.
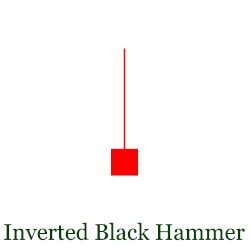
Inverted Hammer
As with the Hammer, a downtrend is vital, but in this case, the candlestick again has a small real body, but with a long upper shadow and small lower shadow. The market has rallied and failed back lower. A bullish reversal is only signalled when the price subsequently moves above the high of the Inverted Hammer.
Shooting Star
This candlestick has a small real body, with a long upper shadow and small lower shadow, but requires an underlying uptrend. It signals a likely shift to lower prices.

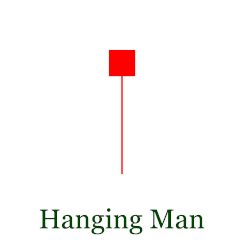
Hanging Man
Like the Hammer, the Hanging Man candle has a small real body, small upper shadow and long lower shadow. But in this case it occurs in an uptrend and the signal for a shift to more negative (bearish) is only when the market subsequently breaks below the low of the Hanging Man candlestick.
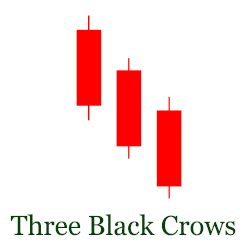
Three Black Crows
Three Black Crows pattern is made of three large black (bearish) bars going lower consecutively indicate a broader, intact downtrend.
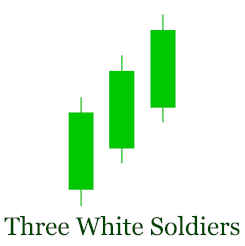
Three White Soldiers
Three White Soldiers pattern is made of three large white (bullish) bars going higher consecutively indicate a broader uptrend set to continue.
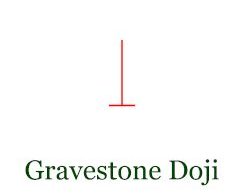
Gravestone Doji
This bearish reversal pattern will show a long upper wick and a flat candle body that is created when the opening price, closing price, and price low of a charted time interval are found near the same price level. The Gravestone Doji indicates strong potential for declining price values in the market and this trading signal can be used when establishing short positions.
Marubozu
This chart pattern (which can be either bullish or bearish) has a long candle body without upper and lower wicks. Since this pattern indicates a decisive price move into the close, traders will often view the confirmation of a Marubozu candle as a potential breakout or the emergence of a new price trend.

Dragonfly Doji
This bullish reversal pattern will show a long lower wick and a flat candle body that is created when the opening price, closing price, and price low of a charted time interval are found near the same price level. The Dragonfly Doji pattern indicates strong potential for rising price values and this trading signal can be used when establishing long positions.

Abandoned Baby
This reversal pattern occurs at the end of a strong trend in market prices and is composed of a series of three separate candlesticks. Abandoned Baby pattern requirements combine a long price candle with a Doji that is followed by a third candlestick which gaps away from the other two price periods (moving in the direction of the expected reversal).
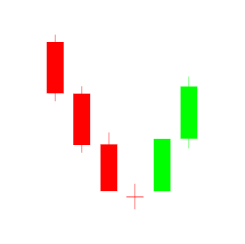
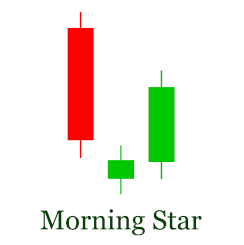
Morning Star
The Morning Star pattern is a three candle reversal formation that is composed of one long bearish candlestick, a smaller middle candlestick (which can be bullish or bearish), and a long bullish candle. Morning Star candlestick patterns are used by traders to identify instances of a potential trend reversal (or a “turnaround” in prices) that can be used to establish long positions.
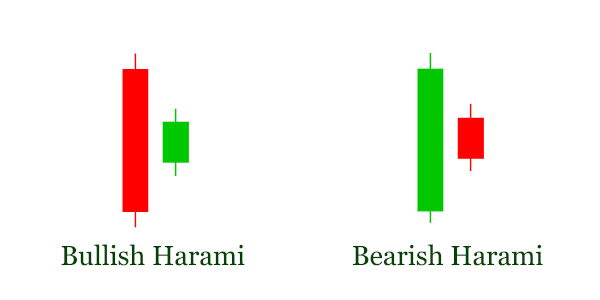
Bullish Harami/Bearish Harami
Harami patterns are two-candle reversals that occur at the end of a dominant price trend in the market. In these patterns, the body of the second candle is completely contained within the body of the first candle. When trading, the size of the second candle determines the level of strength in the pattern because a smaller second candle body indicates greater chances of a trend reversal.
Rising Three/Falling Three (3-Method Formation)
In the Rising Three pattern, we have rising 3-Method Formation (left), a large bullish green candle is followed by three smaller bearish red candles that are contained within the range of the first green candle. The last bar is another green bullish candle that breaches and closes above the previous high. This is considered a bullish continuation pattern and proof that buyers have regained control of the market.
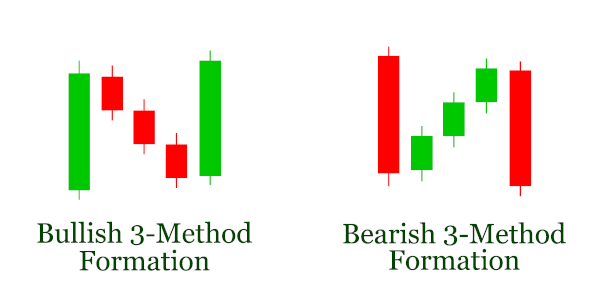
The Falling 3-Method formation (right) consists of a long red or bullish bar followed by three smaller bullish candles. It is considered a bullish continuation pattern that indicates sellers, or bears, are back in control after a slight upward trend. It is used by traders to initiate new short positions or add to pre-existing ones.
Conclusion
Candlesticks charts and patterns are a great addition to any technical analysis that a trader may do. They can be used alongside regular chart patterns and trend following tools to help build a strong and sustainable trading strategy. These are a handful of the most significant candlestick patterns, so if the charting student and beginner trader find success with this type of analysis, there is more to discover.