
Rising Three Methods candlestick patterns indicate bullish continuation in an uptrend that has already been established. Traders are able to use these events as a signal to initiate long positions based on the expectation that market prices may travel higher in future sessions. Rising Three Methods chart patterns develop when the price action of a security has these characteristics:
- Initial price bar is a bullish Japanese candlestick that has a long real body and occurs during a clearly defined uptrend.
- Candlesticks that follow will generally unfold in a series of three-straight small body candles. These candles trade higher than the price low and below the price high of the initial candle.
- The final candlestick is the last bullish candle in the sequence with a long real body that breaks the price highs of the first candlestick. The final Japanese candlestick must also close above the price high and the closing price in the first candle.
When a Rising Three Methods candlestick appears, bulls are expected to be in charge during the coming sessions. However, as the formation develops, the bullish trend also takes a short pause (during three bearish candle periods) in order to consolidate and allow buyers to enter the market for this emerging trend activity:
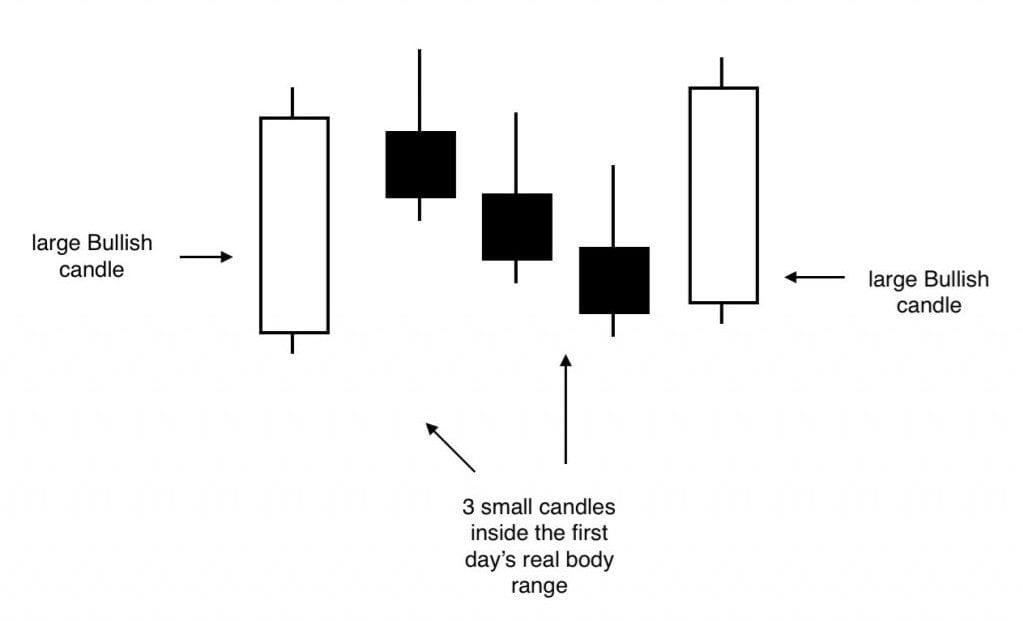
For these reasons, the Rising Three Methods candlestick pattern can be thought of as either a consolidation or continuation price structure. Active traders will generally use this pattern to signal new opportunities to open long positions before the prior uptrend resumes. Of course, there is some flexibility with respect to the specific price parameters involved as long as the overall formation of the structure resembles the pattern depicted in the graphic above.
Chart Example: Rising Three Methods Candlestick Pattern
In this chart example, gold markets are experiencing a period of sideways consolidation after a long-term uptrend. Near the middle of the chart, a Rising Three Methods pattern appears and traders would be able to open bullish positions one the final price bar closes. Aggressive traders can establish an entry point before the fifth candle in the pattern closes, but trades should be exited in the event there is a failure during the final price bar (which would mean the pattern never completes).
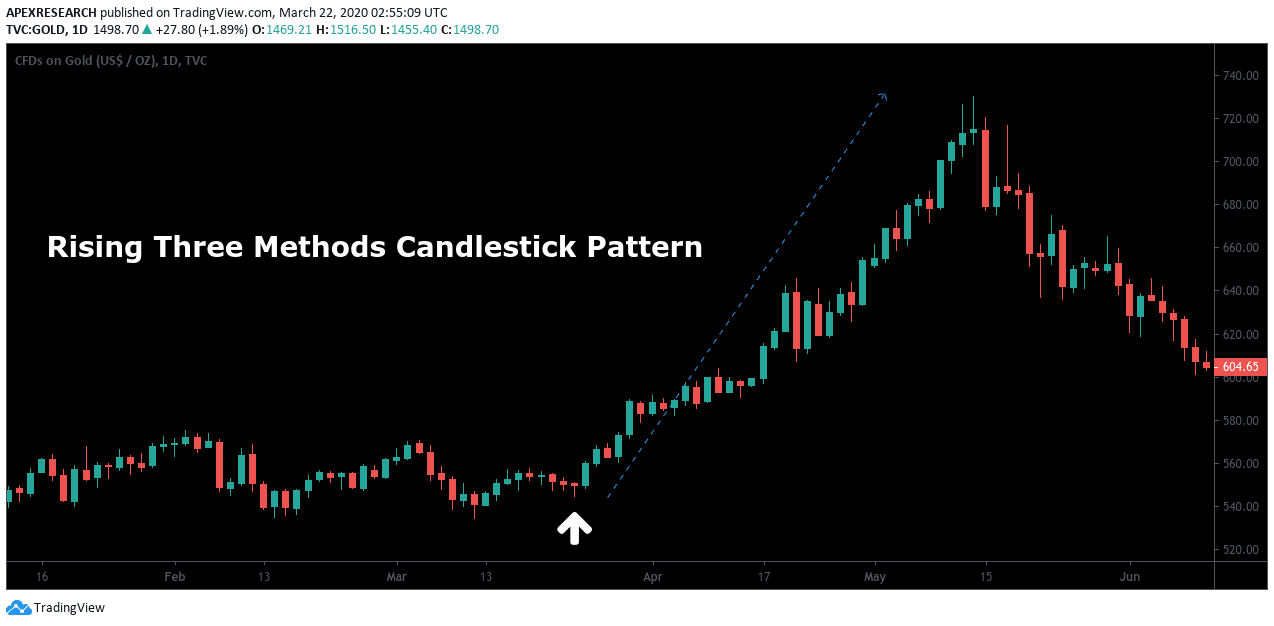
In practice, it’s important for traders to understand that new positions should not be opened in cases where the Rising Three Methods formation occurs near a major resistance level (trendline resistance or historical resistance) as unexpected selling pressure can work to invalidate the pattern. Additionally, traders should protect each position using a stop-loss order that can be placed below the price low of the formation (usually found either in the first candle or in one of the middle three candles). As we can see in the chart example above, the Rising Three Methods candlestick pattern often occurs as a precursor to significant gains which is why the signal can be valuable for bullish technical analysis traders.
Ask Traders Summary: Rising Three Methods Candlestick Pattern
- Rising Three Methods patterns offer signals which indicate a bullish continuation occurring in uptrends.
- Final candle in the sequence is the decisive time period because it shows whether or not market bears will be able to stop the resumption of the previous uptrend. Essentially, the fifth candle confirms that bulls have maintained control in the market.
- Ideal formations in the Rising Three Methods candlestick pattern formation will include long candle formations in the first and fifth positions, with small candle bodies in the second, third, ad fourth positions.
- Stop-loss levels can be identified using the Rising Three Methods pattern. Traders can place stop-losses below the lows of the initial price candle, with profit targets at least 3x the trade’s total level of accepted risk.
PEOPLE WHO READ THIS ALSO VIEWED:


