
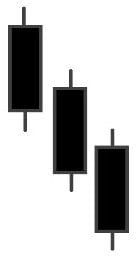
Three Black Crows candlestick patterns indicate rising trend momentum (during downtrend) or an increased possibility for trend reversal (during uptrends). In both cases, the price outlook associated with this candlestick formation is decidedly bearish and this is why many traders will establish short positions when the pattern becomes visible in an asset’s chart history. Three Black Crows chart patterns consist of three Japanese candlesticks (with long bodies), each of which has a price open that is inside the body of the prior candle and a price close that is lower than the prior candle:
Identifying the Three Black Crows chart pattern is an exercise that is largely visual in nature, as traders must actively monitor for developments or when finding a new pattern (rather than setting an Expert Advisor or algorithm to do the work). When these patterns occur, market bulls might a trading session with prices modestly moving relative to the closing price of the prior day. However, these events quickly turn lower as bearish traders emerge and dominate the market trend. This type of activity continues for three consecutive sessions, and each price candle is extended with a small shadow (or wick). When this price pattern emerges, expert traders might project lower prices for the market and initiate short positions related to the asset.
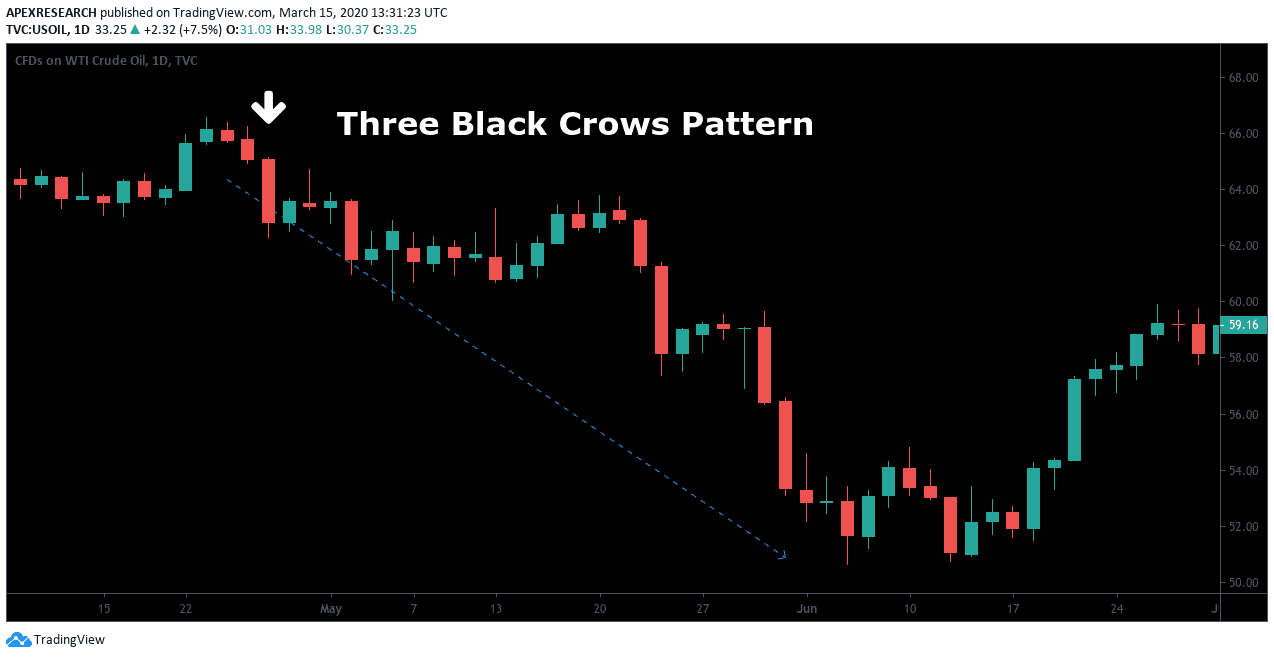
Chart Example: Three Black Crows Candlestick Pattern
As a chart pattern that is largely visually-based and subjective in nature, it is generally best for traders to use Three Black Crows as a way of establishing a market stance (either positive or negative) or to confirm readings generated by other indicators in technical analysis. In the chart example below, we can see that a Three Black Crows pattern can signal the beginning of an emerging downtrend (and the top of a prior uptrend):
In this case, traders might have used the Three Black Crows pattern to exit prior long positions or to establish new trading positions from the short-side. When live positions are taken, stop-loss orders should always be implemented and these should be placed above the price high of the pattern formation. This price level will be based on the first candlestick in the three-bar sequence, and traders can simply use the price high from this period as a risk limitation zone.
Additionally, traders must understand that volume levels can play a significant role in the accuracy of a Three Black Crows Pattern. When volume levels are elevated, this bearish price pattern can carry much greater weight in terms of its predictive ability in projecting continued declines. Essentially, these types of external indicators can work in conjunction with one another in order to create a cohesive trading strategies based on Japanese candlestick analysis. Without these objective indicators, trading probabilities might be reduced and total profit levels may not reach maximum potential.
Ask Traders Summary: The Three Black Crows Pattern
- Three Black Crows candlestick pattern indicates rising trend momentum (during downtrend) or an increased possibility for uptrend reversal (during positive market movements).
- The chart patterns consist of three long-bodied Japanese candlesticks with a price open that is inside the body of the prior candle and a price close that is lower than the prior candle (which occurs over three consecutive trading sessions).
- Trading signals are most reliable when the reversal is confirmed by other indicators and high volume levels can help determine the strength of the market’s upcoming trend movements.
- When live positions are taken, stop-loss orders should always be implemented and traders can place these orders above the price high of the pattern formation as another protective measure.


