
Harami candlestick patterns indicate a trend reversal in the underlying market price of an asset. As a basic candlestick chart pattern, traders of all levels can learn about the way the formation is structured, in addition to the various interpretations involved when trading live market trading positions are established. The Harami Japanese candlestick pattern can occur in both bullish and bearish markets, which means that the formation can be useful in any environment. A bullish Harami pattern indicates an upward price reversal, whereas the bearish Harami pattern indicates a downward price reversal may be possible.
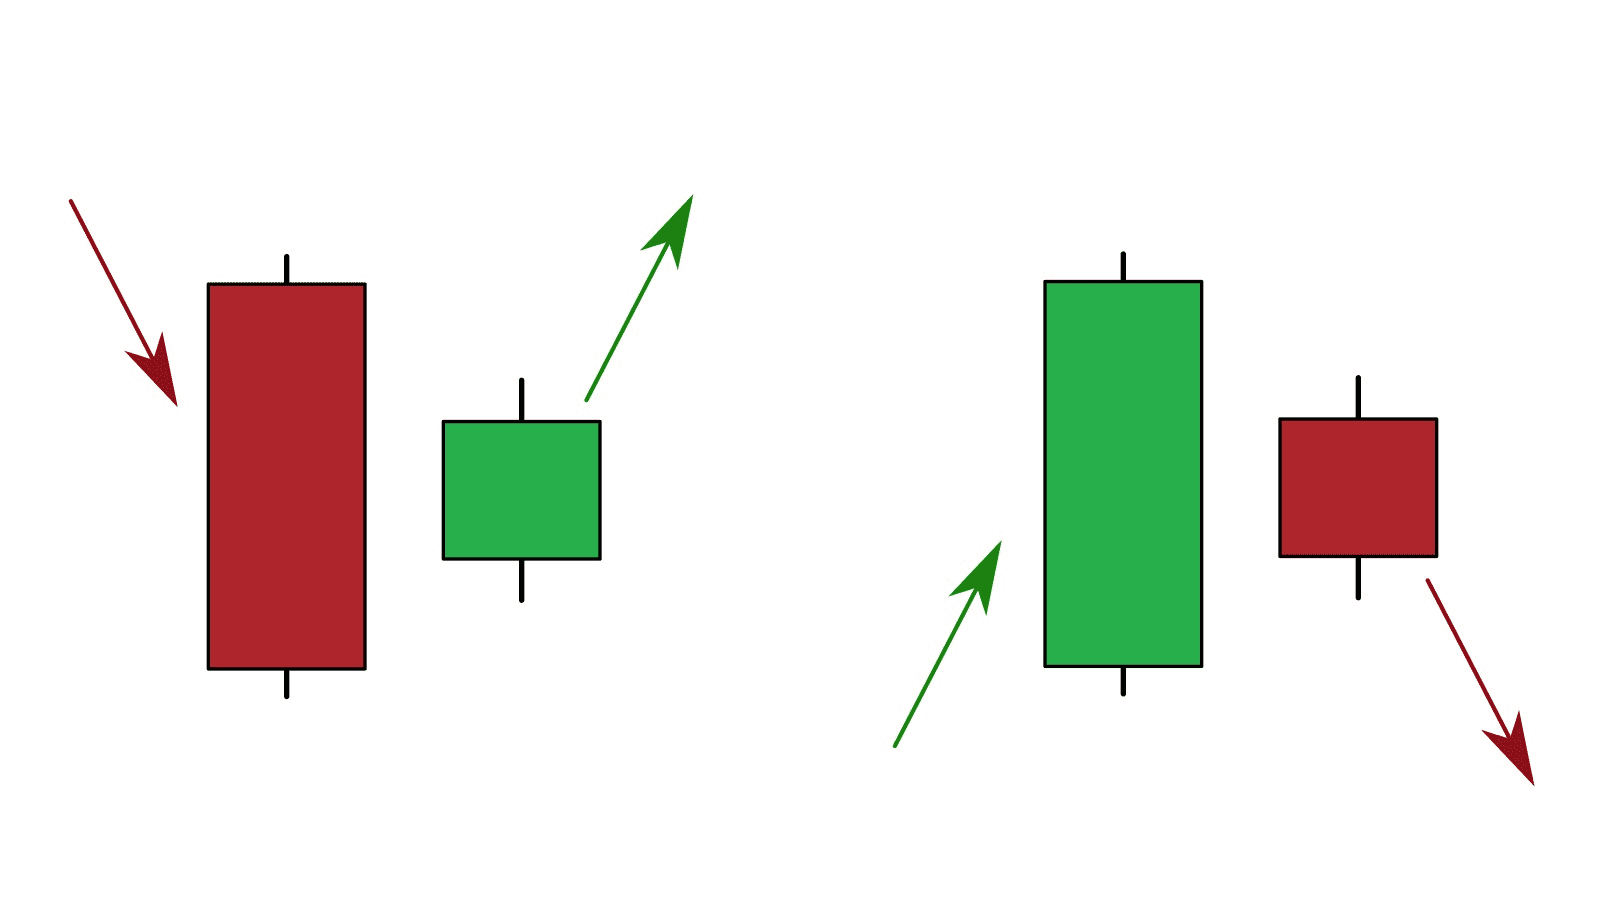
Broadly speaking, Harami patterns consist of two candlestick periods, the first of which occurs with a decisive candlestick formation (characterized by a long candle body). This candle is followed by an opposing price period, where sentiment is centered in the opposite direction. In other words, a bullish Harami consists of a long red candle, followed by a smaller (inside) green candle while a bearish Harami consists of a long green candle, followed by a smaller (inside) red candle.
- Bullish Harami Patterns: begin with a large red candle, followed by a smaller bullish candle on the second day. The pattern shows that prices managed to turn around and gap higher on Day Two. This occurs without the second candle breaking the lows from Day One.
- Bearish Harami Patterns: begin with a large green candle, followed by a smaller bearish candle on the second day. The pattern shows that prices began to fall on Day Two. This occurs without the second candle breaking the above the highs from Day One.
Market situations that tend to lend themselves well to trades using Harami patterns are often found at the end of a significant trending move that may have created an overbought or oversold condition for the asset. As the prior trending move reaches its completion point, the formation of a Harami pattern can be used as the basis for live market positions.
Chart Example: The Harami Candlestick Pattern
In this chart example, Japanese candlestick traders were alerted to the possibility of a downside reversal in price activity, after the clear formation of a Harami pattern occurred near the end of a previous uptrend. For expert traders, this would be a strong signal to sell the asset through the initiation of short positions.
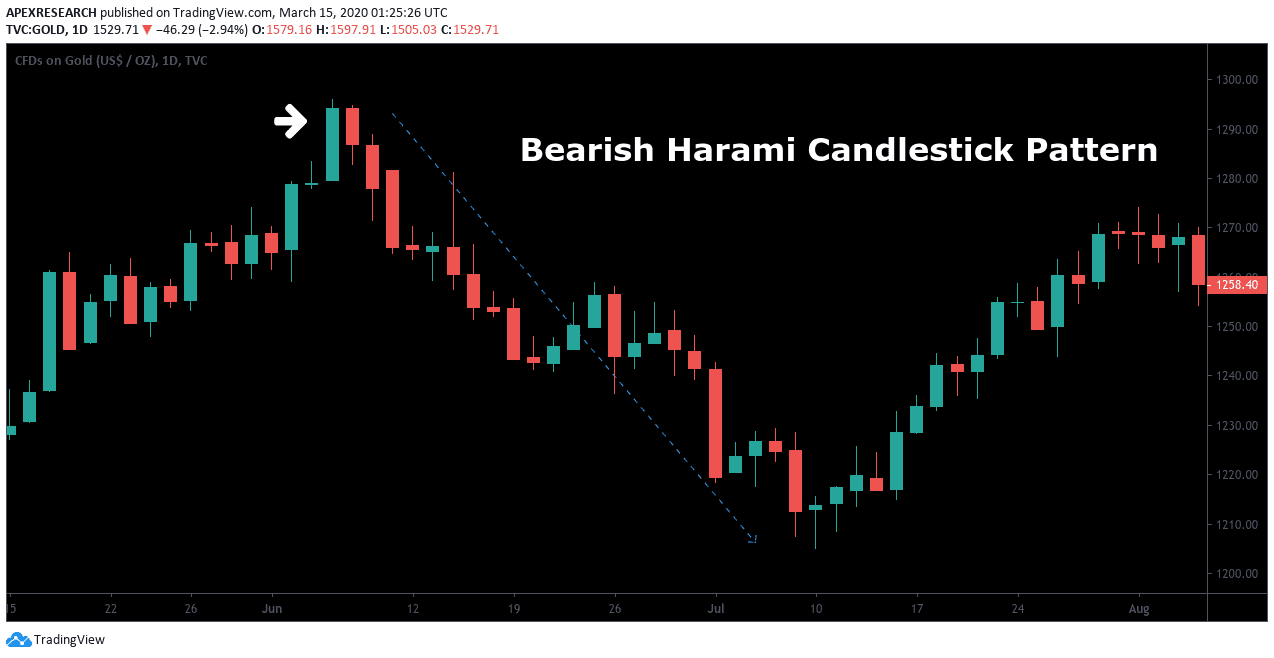
As we can see, prices head lower almost immediately after the formation of the Harami candlestick pattern. This means traders could have established short positions in the asset, with stop-loss orders placed above the high of the first candlestick in the Harami pattern. Under this scenario, traders could have captured significant gains while experiencing little to no drawdown on short positions. Since these patterns occur in relatively high frequencies, traders can implement Harami trading strategies as part of a consistent repeatable strategy to capture profits.
AskTraders Summary: The Harami Candlestick Pattern
- Harami candlestick patterns indicate a heightened potential for reversal in price trends.
- In most cases, Harami formations will includes a large, solid candlestick (indicating a sizeable price move), which is followed by a smaller opposing candlestick that is contained within the body of the first candle in the formation.
- Once a Harami pattern becomes visible, positions can be established using the price high or price low of the formation (depending on whether the readings are bullish or bearish).
- Advanced traders can use additional indicator tools as a way of confirming the validity of a Harami candlestick pattern. However, this will also limit the number of trading signals that become visible during a given period of time.
PEOPLE WHO READ THIS ALSO VIEWED:


