Divergence is a very useful tool to help traders spot trend reversals or continuation patterns. Being able to spot these types of patterns is a massive advantage as they will help you to identify new trading opportunities and give you an idea of future price action.
In this guide, we’re going to cover everything you need to know about divergence, including what it is, the different types and how to spot & use them effectively.
What Is Divergence?
Before we get started, it’s important to first understand what divergence is and how we can use it in our day trading strategies.
Divergence as a general term in trading can be defined as when an oscillator or momentum indicator does not confirm the direction of the current price movement. This can be either bullish or bearish.
It occurs when price makes a higher high or lower low and the momentum indicator or oscillator will do the opposite (make a higher high if price makes a lower low and vice versa).
Types of Divergence
There are two types of divergence:
- Regular Divergence
- Hidden Divergence
Within these types, there an additional two subsets:
- Bullish Divergence
- Bearish Divergence
So, all in all, here are four possible types of divergence:
- Regular Bullish Divergence
- Regular Bearish Divergence
- Hidden Bullish Divergence
- Hidden Bearish Divergence
To complicate matters even further, you can also have ‘mild’ divergence, where a disparity exists but it is not as strong.
Hidden Divergence vs Regular Divergence
The main difference between Hidden Divergence and Regular Divergence is that Hidden Divergence is a sign of trend continuation, whereas Regular Divergence is a sign of trend reversal.
Hidden divergence occurs when an oscillator or momentum indicator makes a higher high or lower low, but the price does not. It usually occurs during price consolidation or corrections and can be used as a continuation pattern or signal.
What Is Bearish Divergence?

Bearish divergence is when the price of an asset reaches higher highs, but the momentum indicator or oscillator shows lower highs. The discrepancy between price action and the momentum indicator indicates that the momentum in the current price trend is slowing and we could see a fall in price about to occur soon.
What Is Bearish Hidden Divergence?
Hidden bearish divergence occurs when the oscillator continues to make lower lows, but the price action does not, and instead begins to consolidate.
As mentioned previously, hidden divergence can be used as a continuation. So, it indicates that we could see price break to the downside to continue its current trend.
Example of Bearish Hidden Divergence
Here is an example of Bearish Hidden Divergence:
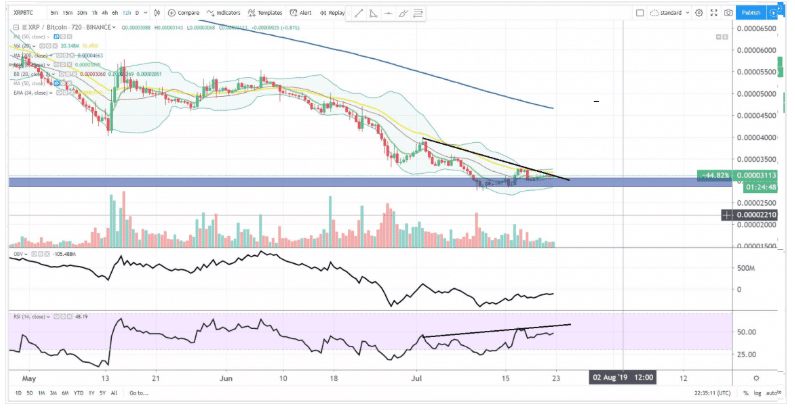
In the above example, we can see $XRP #Ripple on the 12-hour chart from back in July of 2019, with the price making a lower high while the RSI made a higher high.
Why is this a problem? If bulls can somehow manage to stop the bleeding, your RSI is already overbought and that will cut the run short. This was a clear sign of bearish continuation to come.
How to Spot Bearish Divergence
We confirm a hidden bearish divergence when the price shows lower tops, and the indicator gives higher tops.
The regular divergence pattern is used to forecast an upcoming price reversal. When you spot a regular bearish divergence, you expect the price to cancel its bullish move and switch to a downward movement.
Example of Bearish Divergence with OBV
Here is a good example of bearish divergence with OBV:
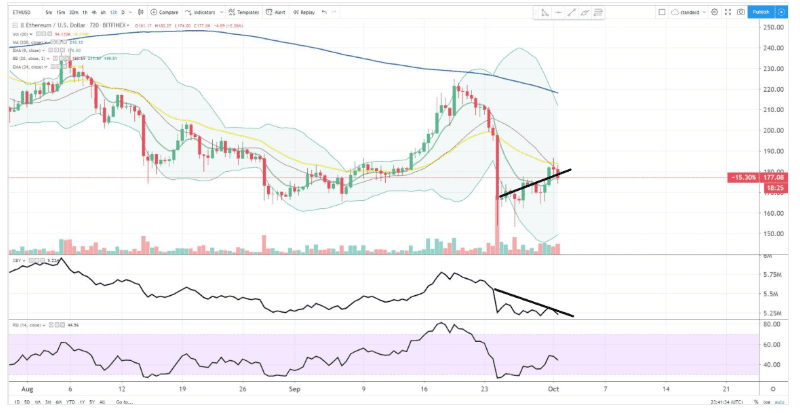
In the above example, we have $ETH #Ethereum on the 12-hour chart from back in October of 2019, with the price working through a bearish continuation pattern.
As you can see, the price was making higher highs while the OBV was making lower highs, suggesting that the price was moving up without sufficient volume and a further bear correct was due.
What Is Bullish Divergence?

Bullish divergence is the opposite of bearish divergence. Bullish divergence occurs when the price is creating lower lows, but the momentum indicator is showing higher lows, indicating a weakening of the trend and a potential reversal.
What Is Bullish Hidden Divergence?
Again, it is the opposite of hidden bearish divergence. When price is in an uptrend and consolidates, not making any higher highs, but the oscillator continues to make higher highs, this is hidden bullish divergence.
It indicates that we may see an upside breakout and continuation of the bullish trend.
Example of Hidden Bullish Divergence
Here is an example of Hidden Bullish Divergence
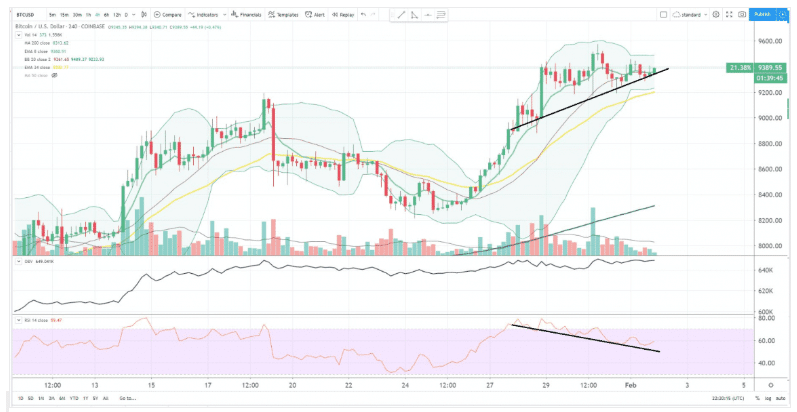
In the above example from Bitcoin on the 4-hour chart back in early February, the price was putting in higher lows while the RSI cooled off, setting things up nicely for a new bull leg higher.
How to Spot Bullish Divergence
As both divergences look for “disagreement” between the technical indicator you are using and the price action itself. In the case of a bullish divergence, the signal occurs when the indicator makes higher lows (becoming less bearish) while the price action itself is establishing lower lows.
Example of Bullish Divergence with OBV:
Below is a textbook example of bullish divergence with OBV:
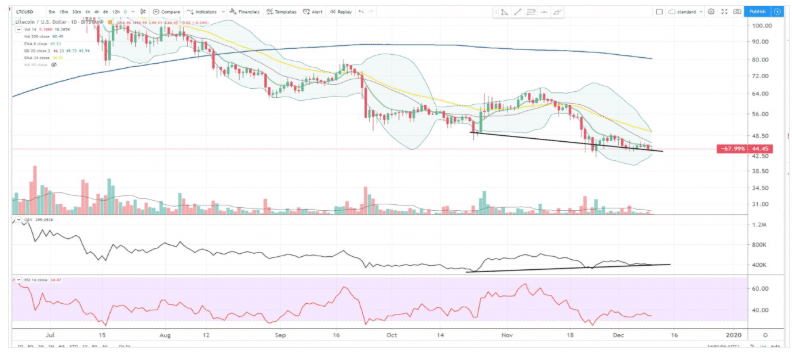
Here, you can see Litecoin on the daily chart from back in December of 2019. The price was making lower lows while the OBV made higher lows. This suggested that people were loading the stock as it was falling, presaging a reversal.
How Do You Use Divergence?
Divergence can be used to either spot the potential for a trend reversal, or if you are looking for hidden divergence, it can be used to spot a trend continuation.
Divergence Trading Indicators
Some of the indicators that can be used to spot divergence are:
- Relative Strength Index (RSI)
- On Balance Volume (OBV)
- On Balance Volume (OBV)
- Stochastic Oscillator
- Momentum and Bollinger Bands
Relative Strength Index (RSI)
A momentum oscillator, that gauges the direction and power behind price movements. It is most often used as a measure of being “overbought” or “oversold”. RSI calculates based on the candle close, which is why candle bodies are used rather than candle wicks to determine divergence.
On Balance Volume (OBV)
Another momentum indicator, it measures the flow of bullish and bearish volume to help draw a picture as to the strength or weakness of the underlying security. More or less, the OBV tells you if people are loading or dumping, and as with RSI, the OBV calculates based on candle close so we use candle bodies rather than wicks to determine divergence.
Moving Average Convergence/Divergence
In addition, Moving Average Convergence Divergence (MACD) is a trend-following momentum indicator that shows the relationship between two moving averages of a security’s price. The MACD collects data from different moving averages to help traders identify possible opportunities around support and resistance levels.
Stochastic Oscillator
On the other hand, a stochastic oscillator is a momentum indicator comparing a particular closing price of a security to a range of its prices over a certain period. The oscillator’s sensitivity to market movements is reducible by adjusting that time or by taking a moving average of the result.
Momentum and Bollinger Bands
Also known as the 60-minute strategy, this technique uses both Momentum trading and Bollinger Bands strategies. Momentum trading is when you buy securities rising and sell them when they look to have peaked.
While Bollinger Bands are the statistical chart that characterises the prices and volatility over time, in this technique, it is all about volatility meets direction.
How to Stop Loss When Trading Divergence?
When trading divergence, you can always use Stop Loss and put it above the last top on the chart, which confirms bearish divergence. If the divergence you are dealing with is bullish, you should place a Stop Loss below the previous bottom on the chart.
Take Profit When Trading Divergence
To use a Take Profit order, you can establish a price at which you want to sell a security. This price needs to be above the price at which the security was bought to ensure that you will profit on the sale.
The Bottom Line
As a general rule with any candle or chart signal or pattern, the longer the time frame the stronger the signal.
That means that you should be careful using bearish and bullish divergence on shorter time frames like 1-hour and 4-hour.
Divergence can be a great way of confirming trend reversals or continuations, and if used correctly, can form part of an extremely profitable strategy. There are numerous other ways to identify strategies using RSI, including the triple divergence.


