
Abandoned Baby candlestick patterns signify the end of one dominant trend and the beginning of an emerging price reversal. In the market movements that follow Abandoned Baby candle formations, traders will often send valuations in the opposing direction. When this activity occurs, technical analysts are able to establish market positions that can profit from new trends as they develop. Essentially, the Abandoned Baby candlestick formation begins as either a downtrend or an uptrend, which culminates as a three-bar structure (or three individual price candles). In the examples below, we can see an example of a bearish Abandoned Baby pattern (on the left) and a bullish Abandoned Baby pattern (on the right).
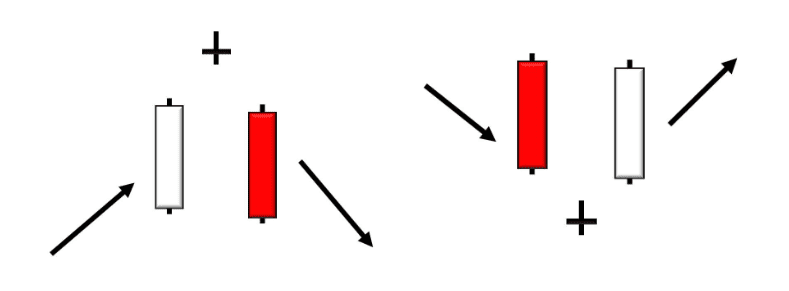
As we can we, the first period creates a large Japanese candlestick (closing in the same price direction as the initial trend) and that is followed by one Doji (or any other price candle which gaps above/below the initial price candle). The third candle in the sequence marks the reversal period where a new majority established itself in the market and prices move in the opposing direction (relative to the original trend direction).
When this candlestick pattern occurs, traders will expect market prices to continue traveling in the direction of the price reversal. Since these are strategies that can be applied to both bullish and bearish markets, traders are always able to find new opportunities to secure profits in the market. Using most digital trading platforms, traders are able to watch for these patterns as a way of signaling new position stances in live market trades. In these cases, traders should understand that the following criteria must be met when trading the Abandoned Baby pattern:
- First price candle: Large bearish candlestick in a downtrend, or a large bullish candlestick in an uptrend.
- Second price candle: Doji candle (of any other price candle) that gaps above prices (after an uptrend) or below prices (after a downtrend).
- Third price candle: Large bullish price candle (after a downtrend), or bearish candle (after an uptrend).
In any Japanese candlestick trading strategy, there will be room for small variations in the basic rule parameters that define each pattern. However, these are the underlying characteristics that should describe any charting scenario that relates to trades (both short trades or long trades) based on the Abandoned Baby price pattern.
Chart Example: Abandoned Baby Candlestick Pattern
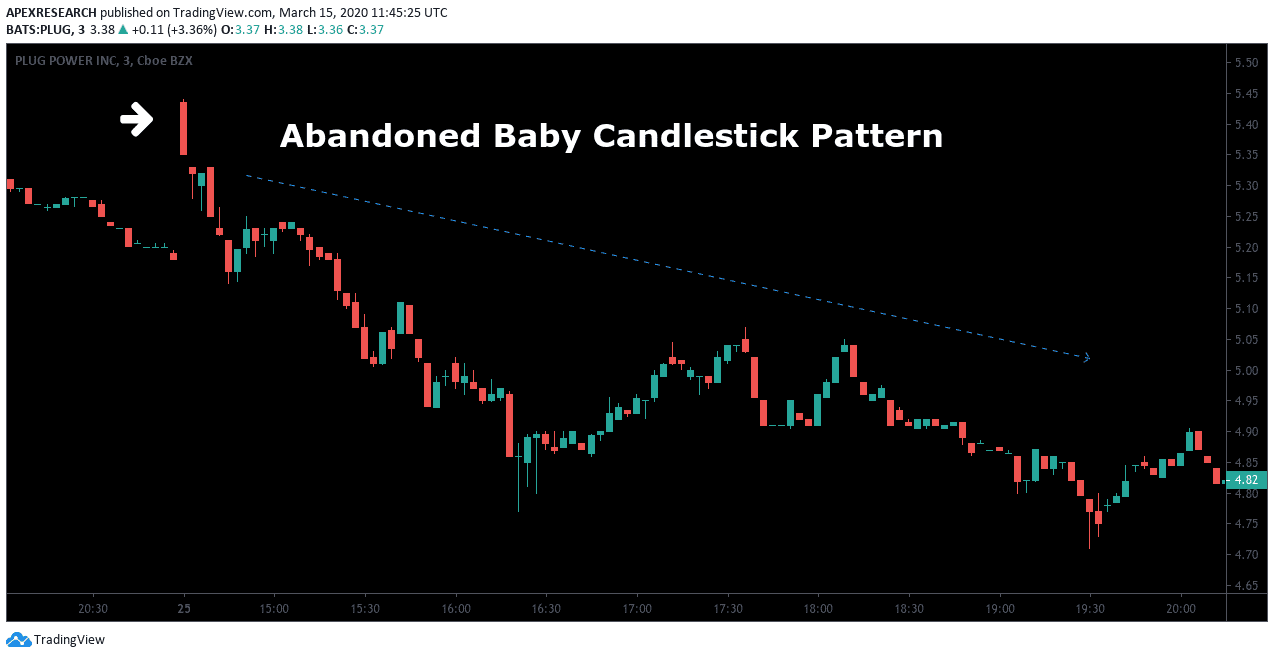
In this example, we can see a bearish Abandoned Baby pattern that projected a significant downtrend price movement. Here, the candlestick formations suggest that markets were unable to maintain pressure on the buy-side and the exhaustive move resulted in a price candle that was both bearish and clearly separated from the rest of the asset’s nearby chart activity. Traders could have established short positions early in this new downtrend, using an optimal stop-loss strategy, which places an order above the high of the “abandoned” price candle. Ultimately, the Abandoned Baby pattern shows us that the psychology of the market was likely to indicate reversals and trades based on that stance would have allowed traders to collect significant profits with relatively limited drawdown on the position.
Ask Traders Summary: Abandoned Baby Candlestick Pattern
- Abandoned Baby candlestick patterns are bullish when they follow a downtrend and the three-period price pattern culminates in a long candle with higher closing prices.
- Abandoned Baby candlestick patterns are bearish when they follow an uptrend and the three-period price pattern culminates in a long candle with lower closing prices.
- Abandoned Baby patterns signify reversals and are best suited for contrarian traders (rather than momentum traders or breakout traders).
- Stop-loss levels should be placed outside of the price high (for bearish patterns) or the price low (for bullish patterns).
PEOPLE WHO READ THIS ALSO VIEWED:


