
There is also a very committed subset of traders that subscribe to a set of rules known as the Elliott Wave Principles, or “EWP” for short. Complex would be an understatement when describing this analytical method. Its enthusiasts, at least the ones that believe and accept the basic premises, glorify its conclusions, as if delivered from heaven above. If you are in a room filled with traders, perhaps one out of ten of the attendees will be an EWP aficionado, but beware of the other nine. If you dare to mention Elliott Wave Theory in their midst, they will shout heresy and all manner of expletives to record their abject disgust for Elliott and anyone that believes such drivel.
Why such a harsh and negative reaction from an obvious majority? As straightforward as Wave Theory appears, many regard it as far too subjective to be of any benefit. Perhaps, too many traders have skimmed the surface of EWP, tried it out in real time, and came away a loser. It does take time and patience to learn the basics in training, then more time to gain enough experience with it to understand its many nuances that pervade each analysis. In other words, it does not suit the whim of impatient traders, which happen to be the majority, whether we agree or not.
Let’s start with a chart for Bitcoin, and then step through the various “rules of the road”
Ralph Nelson Elliott (1871–1948), an accountant by trade, must have had extra time on his hands, because he published a number of works that delved into the perturbations of stock prices on the DJIA. His most famous one was a piece he entitled “Nature’s Laws: The Secret of the Universe”, in which he likened human behavior and herd mentality in a market as mimicking nature by displaying wave patterns that could yield reasonable predictions of future aspirations. He posited that major market movements could be broken down into an “Impulse Wave” of five steps, followed by a “Corrective Wave” of three steps. The confusing part is that there may be waves within waves, and so on.A “Daily” chart of the “BTC/USD” pair is presented, starting from last October and leading up to the current month of February. If you have been following the market, then we know that BTC in February has dipped sharply down to $3,359, then rebounded back above $3,600. It rests today at $3,568. After we touch upon EWP, we can return and see how recent price behavior fits with Elliott’s principles displayed on this chart.
Waves can be positive or negative, but the numbering convention is as follows: The Impulse Wave is numbered from 1 to 5, and the Corrective Wave, A through C. If we look back at our chart, the Impulse Wave starts in the top left corner with “(1)”, then proceeds down to “(5)”, the low point of the period and end of the Impulse portion. The Corrective Wave then takes over with “(A)”, then to “(B)”, and a prediction of “(C)” follows, at roughly $4,700. Our recent dip to $3,359 could be interpreted as a continuation of the (B) leg, but if (C) eventuates, EWP also predicts a sharp fall next.
This last paragraph seems simple enough, but the placing of the various “leg” demarcations is where the skill resides and where mistakes can easily be made. As with any other TA tool, one must understand from experience how the tool or indicator works in all manner of market conditions, in order to arrive at a creditable prediction, i.e., one with a probability greater than 60%. Books have been written on this topic, but the initial chapter usually postulates three “golden rules” that must be met to define the occurrence of a worthwhile wave action properly:
- Leg 2 can never retrace more than 100% of Leg 1;
- Leg 3 is never the shortest of the three impulsive legs, 1, 3, or 5. Usually it is the longest, but this is not always the case;
- Leg 4 never retraces to a level below the peak of Leg 1 in an uptrend or above the trough of Leg 1 in a downtrend.
There are also a variety of corollaries to these tenets, which may try your nerves. For an impulse wave, legs 2 and 4 have a strong tendency to be opposites, i.e., if one is long, the other is short, and vice versa. Corrective waves may be delayed, if fundamental forces at play are particularly strong. Fibonacci ratios also play a major role in EWP. In fact Elliott is given credit for discovering this relationship, which has become ingrained in TA for all traders (Do not suggest that its discovery was due to Elliott’s tedious work, or you could risk mayhem at a social gathering of traders).
As with any other form of analysis, if it works for you and gives you an “edge”, then use it, and refine it as you go along. If it does not, discard it and try something else. The purpose of this article, however, was to apply Elliott Wave Theory to Bitcoin’s price behavior and see how it played out. We have done just that with our “(C)”prediction, but the lack of an accurate timetable is where “subjectivity” enters the equation.
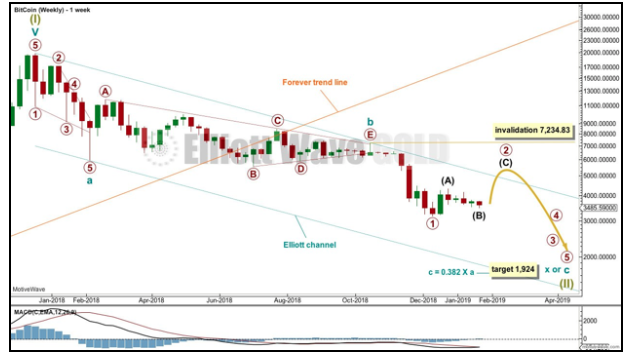
Here she has added a “channel” in Blue, and from the last time the channel was touched, she has written in a forward “hint” at an impulse wave, whose first leg ended at the low point in December. From there, according to the step rules, she, like many other pessimists today, is forecasting a potential “bottom” just below the $2,000 range, based on a specific application of a key Fibonacci ratio of 0.382.
How would an experienced EWP professional describe the current situation? To begin with, Elliott was not just into waves. He was primarily into pattern recognition, such that he would use channel lines, support and resistance, Fibonacci levels as we noted, and converging triangles, it they completed the overall picture for him. One noted TA specialist in the EWP mold is Lara Iriarte. Like any analyst worth their salt, Lara reviews multiple timeframes to get a hint at what is going on behind the chart data. If you start with a monthly chart:

She was unable to find any correlations with Fibonacci ratios, but she did insert the “Forever trend line” in Gold (Note the “Breach”). The logarithmic scale on the right makes for a better analysis from a viewing perspective. Now for a Weekly chart:
As one other bit of insight from her experience, she likens Bitcoin to a commodity: “Bitcoin tends to behave like an extreme commodity: price moves upwards for about 2 – 4 weeks in a near vertical movement at the end of its rises. Following this vertical movement the resulting downwards movement is very deep (in percentage terms) and often very quick. The next rise begins slowly with basing action over weeks or months, and then as the rise nears its end another vertical movement completes it. Also, there are volume spikes just before or at the end, which is another feature typical of commodity like behaviour.”
Do Lara’s associates agree with her? Avi Gilburt is another well-respected Elliott Wave professional, with a much broader distribution channel for his written missives. He takes the above chart, but starts his Impulse Wave count after Lara’s “1”, and substitutes “1” for the “(A)” to be his “Leg 1”. From there, he posits Leg 3 to be at the $6,000 level, as shown, and then after a brief retraction, he predicts a major run-up:
“If the current bullish set-up takes shape, we can see a major break out in 2020. Moreover, the Fibonacci extension price targets, based upon log extensions, would point us to targets of at least $65,000, and potentially well beyond. But to get there, this market obviously has much work to do to climb the wall of worry set in front of us.”
WOW! Is it off to the races once more? But how can two professionals, using the same tools and data, arrive at such disparate forecasts? The two opinions are actually quite closer than you think. Lara’s low point could be Avi’s “wall of worry set in front of us.”
In any event, Technical Analysis is not a perfect art. It is based on probabilities related to human psychology at the moment and the chances that similar patterns will repeat in the future. There are no guarantees. Critics and academicians propose that TA is worthless, that markets move in a random path, and therefore, analytical tools based on the previous history cannot predict future price directions. There are several traders with very large bank account balances that would beg to differ with them. Again, find what works for you, refine it, and try to get that edge that will make you a veteran trader one day.