
On-Balance Volume (or OBV) is a momentum indicator that uses market price and trading volume to make projections about future trends. Traders use it as a way of measuring crowd sentiment and the trading direction of institutional investors, which both highly influential in determining bullish and bearish market environments.
In this guide, we’ll cover all of this and also explore:
- The history of OBV
- What is On-Balance Volume?
- How to use it (with examples)
- Advantages and disadvantages
History of OBV
On-Balance Volume strategies were first designed by Joseph Granville in the early 1960s with a specific focus on global stock markets.
Granville’s investment strategies initially operated on the assumption that trading volume is what works as the key driver of significant price trends.
This approach has evolved to include several additional factors that can be used when constructing live positions in the financial markets.
What is On-Balance Volume?
On-Balance Volume (or OBV) is a momentum indicator used in technical analysis trading that is based on market volume flows.
OBV indicator readings can be used to make projections about upcoming price movements and to establish active investment positions in both bullish and bearish markets.
Granville’s investment theories suggest that asset prices will eventually move in the same direction as the market’s dominant transactional flows.
For example, when stock prices fail to change significantly after market volume increases.
On-Balance Volume works as a cumulative indicator which measures differences between buying pressures and selling pressures over a specific period.
Essentially, the OBV indicator adds market volume that is present during bullish trading periods and subtracts market volume present during bearish trading periods.
Granville was one of the first traders to understand the real significance of volume flow in terms of its net effect on market prices.
Modern-day technical analysts now use the OBV indicator as a way to identify divergences or confirm emerging trends in asset valuations
How To Use On-Balance Volume
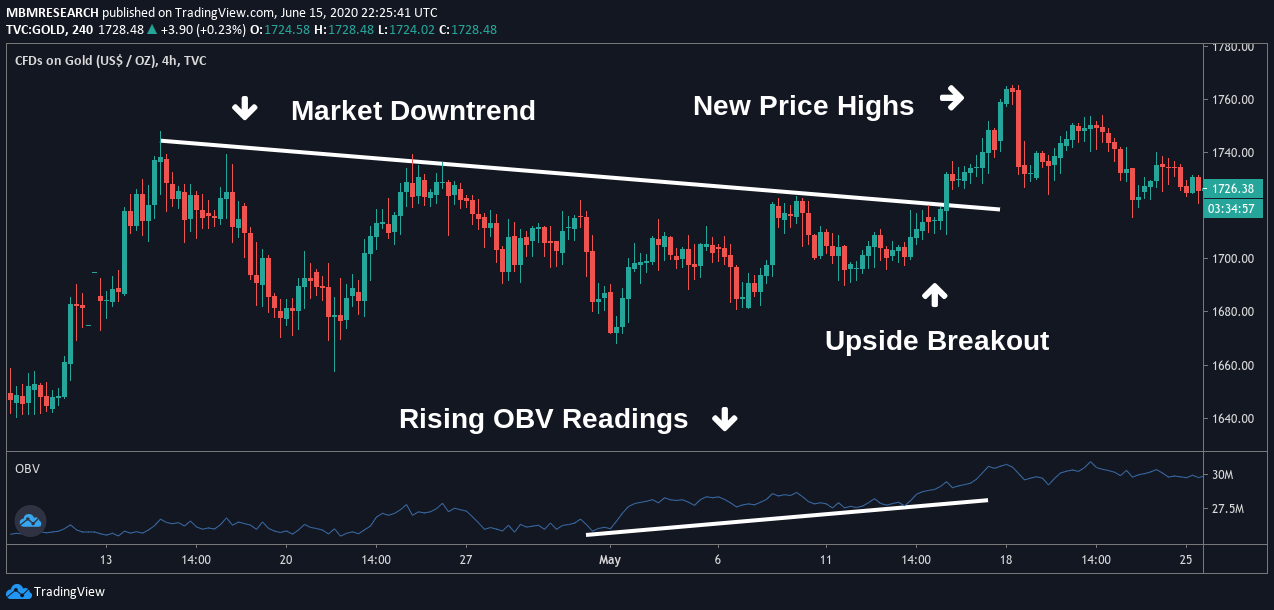
Since Granville’s theory stated that Volume precedes new trends in market prices, the divergence signals recorded by the OBV indicator will often anticipate bullish or bearish reversals.
Bullish divergences occur when the OBV indicator is rising as market prices are falling. In contrast, bearish changes happen when the OBV indicator is falling as market prices are rising.
In the chart below, we can see an example of a bullish divergence that signalled upward price moves even as the market’s dominant trend direction appeared to be in decline.
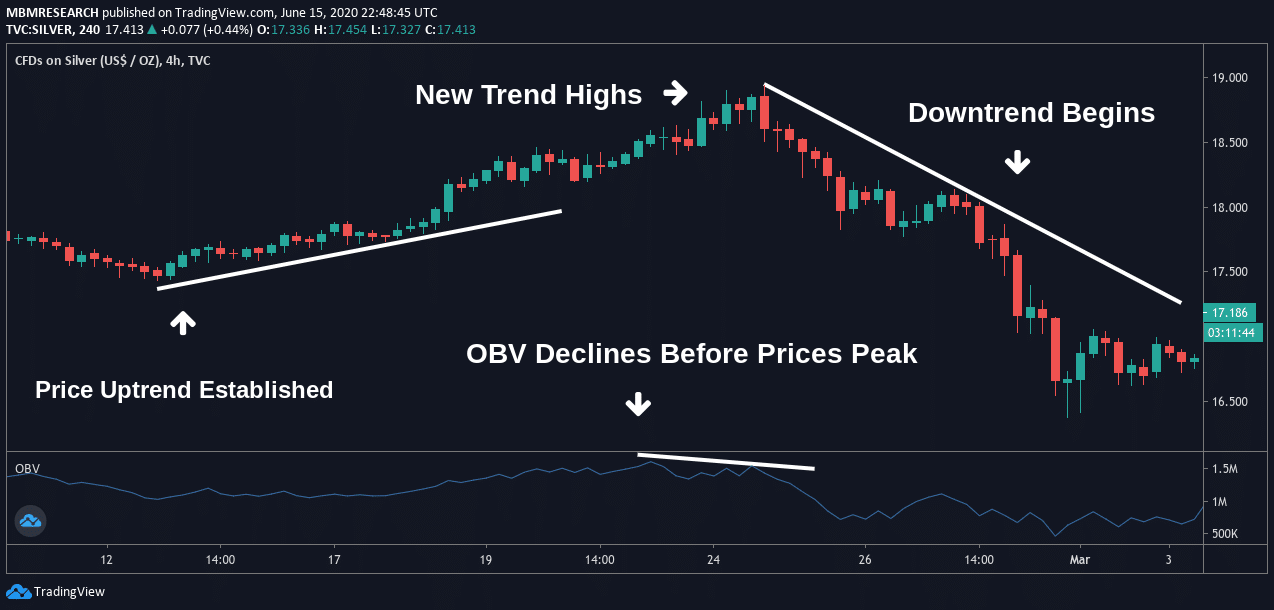
 In the second chart example, we can see a bearish divergence as it becomes visible on the price charts.
Initially, an uptrend is established, but contrarian traders are likely to look for instances of weakness as a signal to enter into short positions.
This occurs as readings in the OBV begin to decline before prices peak, and this should be viewed as a signal to enter into short positions.
Favourable conditions for a short trade are apparent when prices hit new trend highs. Trading gains can, therefore, be captured as a new downtrend begins to guide the market.
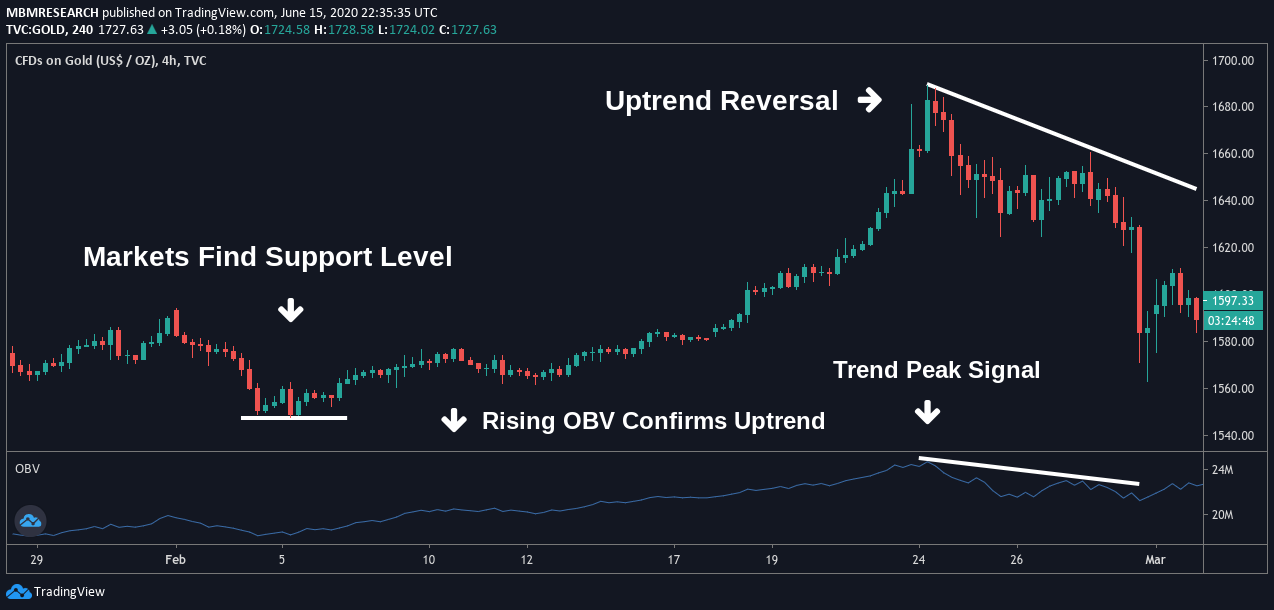
OBV readings can also be used by traders that have developed trend-following strategies.
In the chart example below, we can see markets can find a healthy support level after a period of decline.
Indicator readings begin to rise after this occurs, and this event works as a buy signal for traders looking to establish long positions.
After substantial gains have been achieved, traders should look for areas to exit long positions once the OBV indicator flashes a trend peak signal.
A reversal in the uptrend follows, and the decline in prices could have been known in advance for traders using the OBV as a reversal indicator.
In each of these ways, the On-Balance Volume indicator emerges as a useful trading tool that can be applied in a wide variety of market conditions.
Advantages of OBV
On-Balance Volume is an excellent way of gauging where the smart money is positioned.
Novice investors tend to become distracted by changes in market prices. Still, the OBV indicator offers a way of achieving a higher level of objectivity when trading.
Institutional investors tend to have the most significant influence over the total flow activities, and the OBV is one of the easiest ways for active traders to measure these trends.
Disadvantages of OBV
On-Balance Volume does have its disadvantages working as a leading indicator.
Fundamental events (such as a corporate earnings report or a significant macroeconomic data release) can have a dramatic impact on sentiment when unexpected changes occur.
This can lead to false signals in the indicator. For these reasons, expert traders will often add a lagging indicator (such as a Moving Average) to technical analysis charts to achieve a greater balance to price analysis.
As readings in the OBV indicator can be distorted when major events occur, traders should always look to an economic calendar. Economic calendars will help you avoid the surprise price movements that can sometimes lead to trading losses.
Conclusion
On-Balance Volume works as a highly diverse indicator that is capable of measuring both bullish and bearish forces in the market.
OBV is based on volume flows that often work as a precursor to major changes in the market’s underlying price trends.
Technical analysts use On-Balance Volume as a way to identify price divergences or to confirm an emerging trend in asset valuations.
However, the OBV indicator should not be viewed as a stand-alone strategy. It is often a good idea to add a lagging indicator as a way of achieving greater balance in price analysis.
PEOPLE WHO READ THIS ALSO VIEWED:


