
Not only do they help identify overbought/oversold levels, but they also help to identify and establish both long and short positions. They’re also easy to read, which makes it a popular indicator for traders of all experience levels. In this guide, you’ll learn:
- What a Stochastic Oscillator is
- How to read them
- How to use them in your trading strategy
- Advantages and disadvantages
What Is Stochastic Oscillator?
A Stochastic Oscillator is a momentum indicator used by traders to identify overbought/oversold conditions during a certain trading period. The indicator compares the most recent closing price of an asset to a range of its previous closing prices and is considered an accurate buy/sell indicator.
Essentially, this oscillator allows traders to view current market prices as a percentage range in relation to historical trends that have already become apparent in the market.
How Do You Read a Stochastic Oscillator?
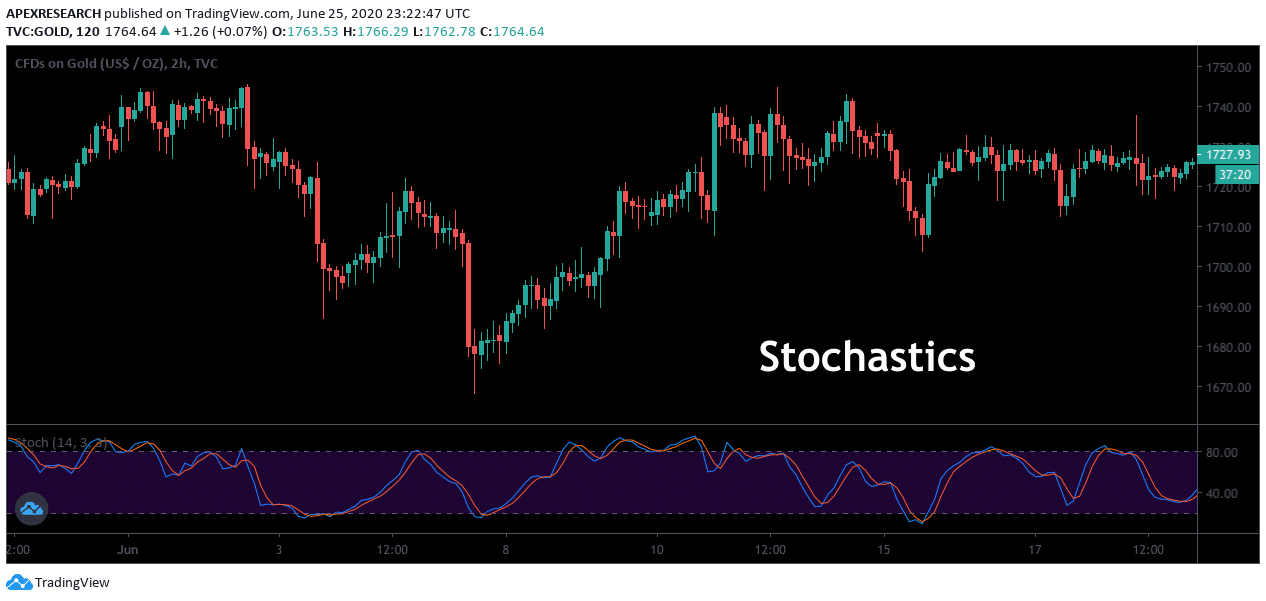
Stochastic Oscillator readings are rangebound, which means that values are always going to fall within a predetermined range (in this case, the range is 0 to 100). As a result, traders use this oscillator to identify differences between overbought market conditions and oversold market conditions.
As a rule of thumb:
- Values above 80 are considered to be overbought
- Readings below 20 are typically considered to be oversold

Stochastic values are generally as two lines, below the price activity on trading charts. In the chart above, the blue line reflects the actual stochastic value for the current trading session while the red line in the indicator field shows a three-period moving average of the oscillator value.
Stochastics oscillators work as a leading indicator because market prices tend to follow trading momentum. As a result, crossovers in these two indicator lines offer trading signals because they suggest reversals have occurred in the market’s dominant trend activities.
How To Use Stochastic Oscillators
Stochastic trading tools are included in most of the charting platforms available in modern markets and these signals are relatively easy to identify by investors of all experience levels. In most cases, the default settings will use a trading period of 14 days. However, this time period can be adjusted in order to match variations in individual trading styles.
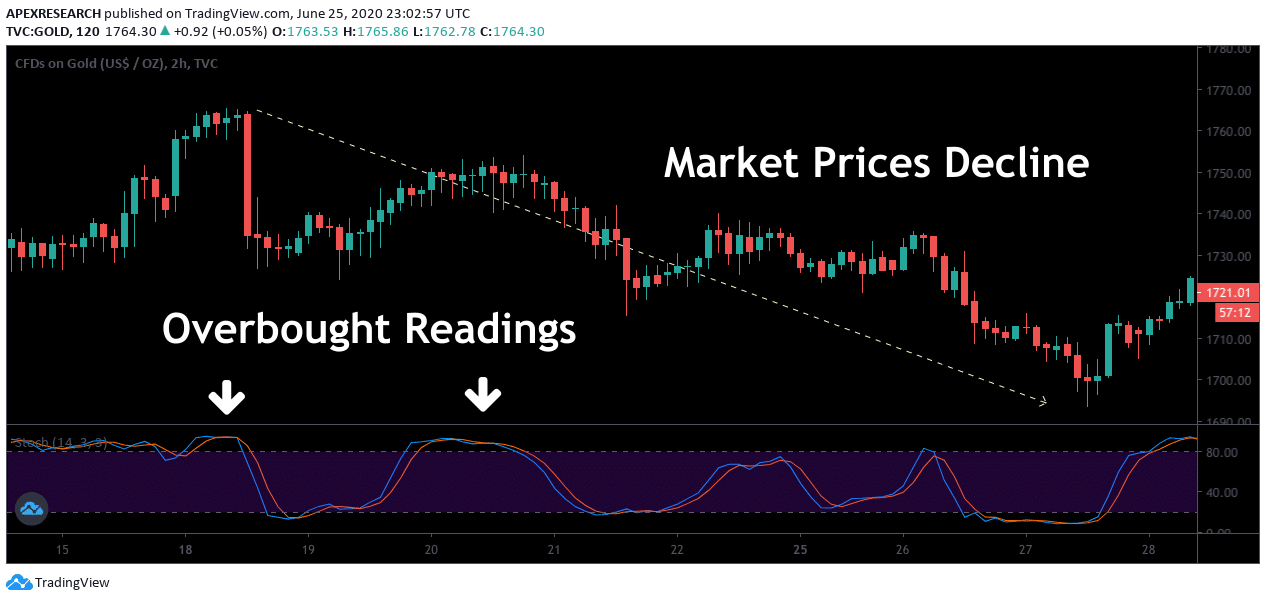
In the chart example shown above, we can see how the oscillator plots overbought readings (above the 80 mark) as an indication that market prices are ready to fall. In these cases, traders would be able to establish short positions as a way of capturing gains while the market declines.
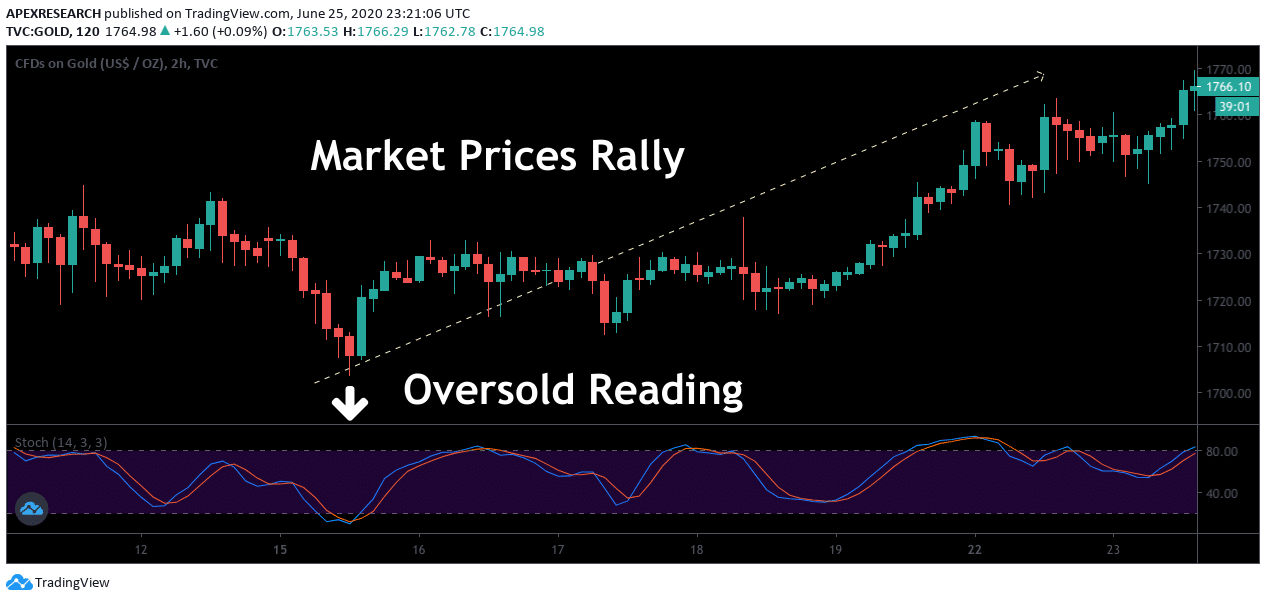
In the next chart example, we can see how the oscillator plots oversold readings (below the 20 mark) as an indication that market prices are ready to rise. In these cases, traders would be able to establish long positions as a way of capturing gains while the market rallies.
Advantages
Let’s run through some of the main advantages to be aware of:
- It can be incredibly useful when used in conjunction with trading strategies that are based on trend strength and momentum
- Traders of all experience levels tend to find stochastic readings to be relatively easy to understand
- Buy and sell signals that are recorded by the indicator are very easy to see
- Signals also appear with a high rate of frequency, which is appealing for day traders or those with an aggressive trading style
Disadvantages
Now let’s take a look at some of the potential drawbacks:
- Readings are more likely to produce false signals in volatile markets
- Requires an additional indicator to act as confirmation, along with protective stop-loss orders
- Traders should avoid any urges to buy or sell based on these readings alone
Summary
- Stochastic oscillator tools are helpful in generating signals that suggest market valuations have become too overbought or too oversold.
- Traders might look to establish long positions after oversold conditions develop because the stochastic readings suggest a bullish reversal might be ready to take place.
- In contrast, traders might look to establish short positions after overbought conditions develop because the stochastic readings suggest a bearish reversal might be ready to take place.
- Divergences between market price and the oscillator values can also be viewed by traders as a potential reversal signal.
PEOPLE WHO READ THIS ALSO VIEWED:


