A Bollinger Band is an indicator tool that is widely used in technical analysis of financial markets. This technical indicator is composed of three different lines, where one sits below and one above the asset price.
Bollinger Bands technical indicator was first introduced by the US-based technical analyst John Bollinger in the 1980s. He created a technical indicator based on the specific parameters (more on that later).
What are Bollinger Bands?
In practice, Bollinger Bands represent one of the most potent and reliable trading indicators in the world of technical analysis. This indicator is mainly used to interpret the strength of a trend and identify market tops or bottoms.
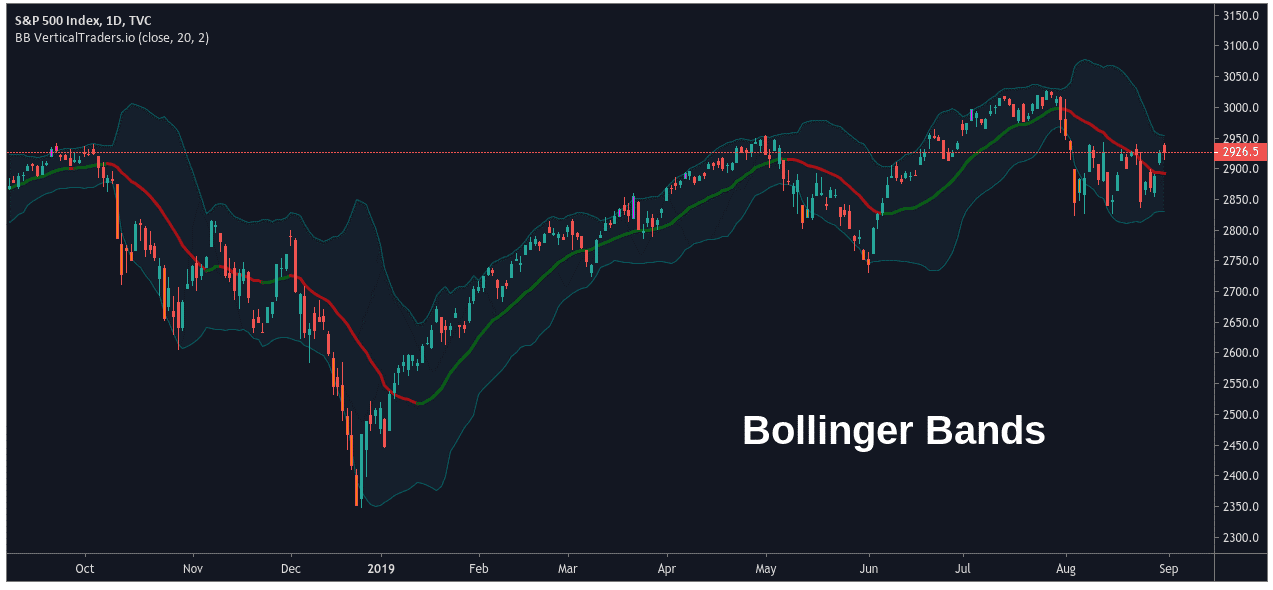
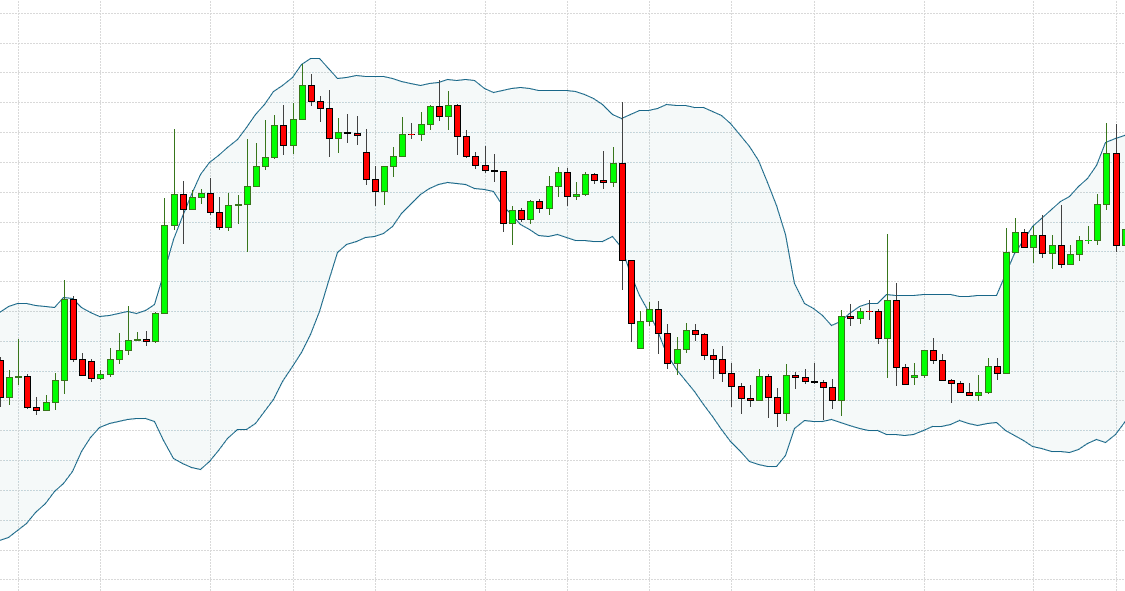
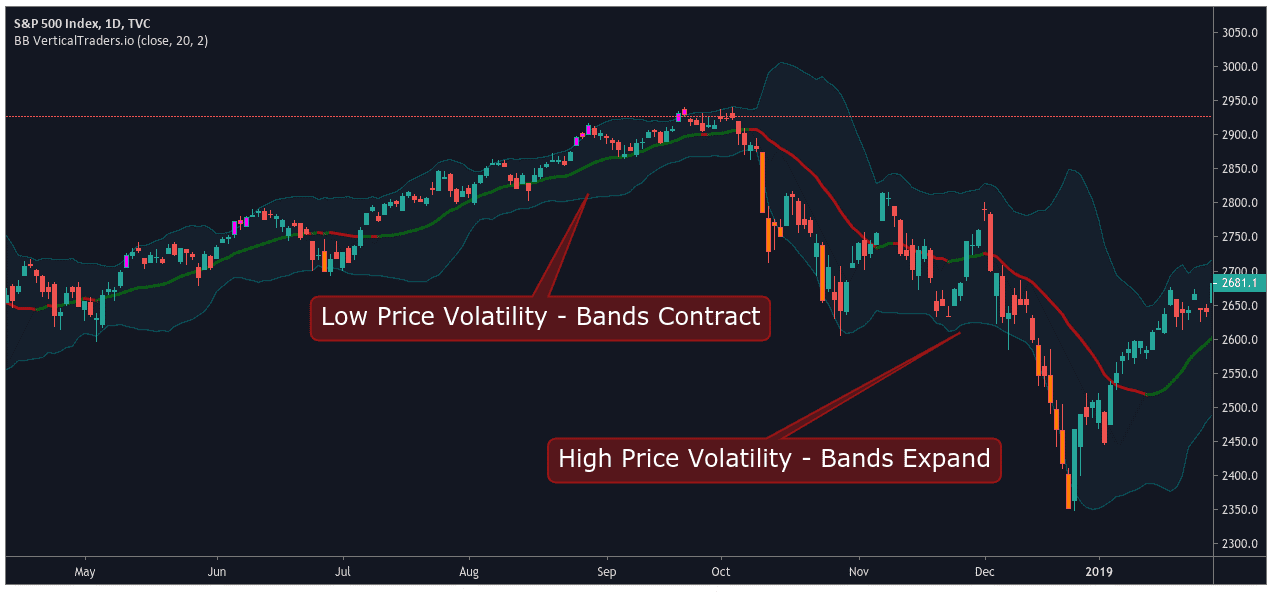
The first thing you would’ve noticed from this chart is the three wavy bands: the upper band, middle band, and lower band. Here are a few key points to bear in mind when analysing Bollinger Bands:
- The price movement outside of the band envelope is usually not sustainable.
- Price action above the upper band indicates overbought markets (and vice versa)
- Contraction represents low price volatility, while expansion represents high price volatility.
- Around 95% of all price action occurs between the upper and lower boundaries.
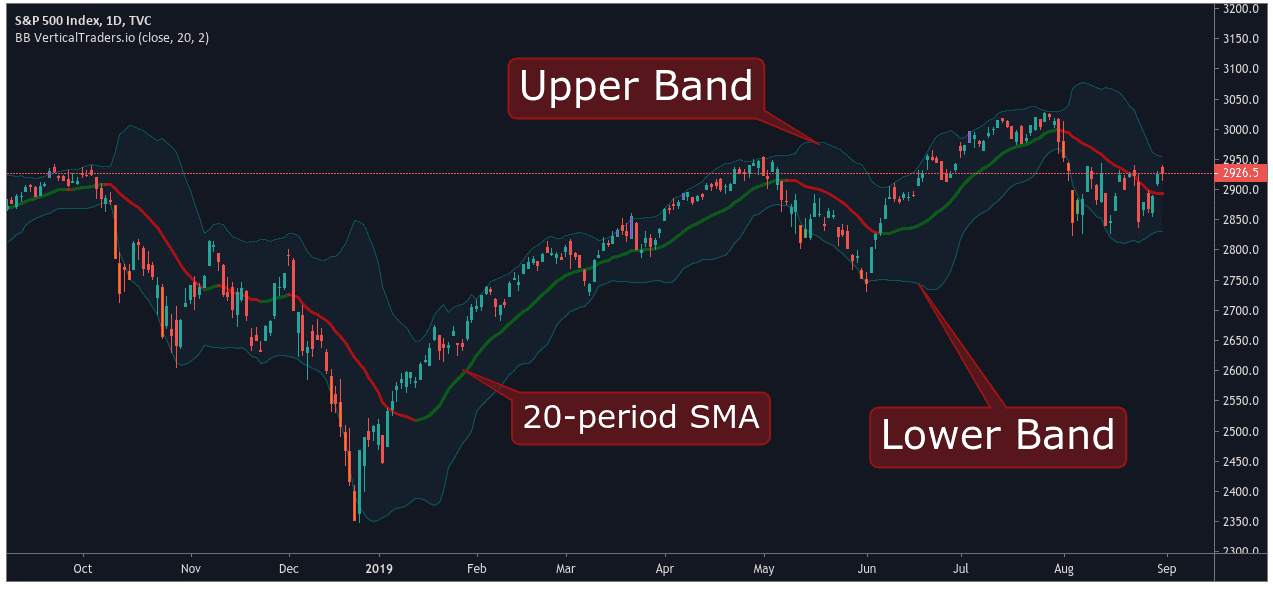
As we mentioned earlier, Bollinger Bands consist of three different lines. The centre line is a simple moving average (SMA), whose default value is usually 20. These values can be adjusted to fit the requirements of each person’s unique trading style.
The upper Bollinger Band represents a value that is two standard deviations above the average (a positive deviation). Conversely, the lower band represents a value that is two standard deviations below the average (a negative deviation).
YOUR CAPITAL IS AT RISK
Bollinger Bands Trading Strategies
There are various strategies involving the use of Bollinger Bands. Let’s unpack each strategy, so you can identify which one will work best with your trading style.
Double Bottoms and Bollinger Bands
A common Bollinger Band strategy involves a double bottom setup. To use this strategy, you need first to set up your chart. The closing price of each bar is crucial to this strategy, so it’s best to use a Line On Close chart.
Next, load the Bollinger Bands on your chart with the following settings:
- Lookback period: 20
- Standard deviation multiple: 2
Then, identify the double bottom (W Signal). The first bottom of this formation tends to have substantial volume and a sharp price pullback that closes outside of the lower Bollinger Band.
Reversals with Bollinger Bands
Another simple yet effective trading method is fading stocks when they begin printing outside of the bands. Now, let’s take that one step further and apply a little candlestick analysis to this strategy.
Instead of shorting a stock as it gaps up through its upper band limit, wait to see how that stock performs. If the stock gaps up and then closes near its low and is still entirely outside of the bands, this is often a good indicator that the stock will correct in the near-term.
Riding the Bands
The single biggest mistake that many Bollinger Band novices make is selling the stock when the price touches the upper band or buy when it reaches the lower band. Bollinger himself stated a touch of the upper band or lower band does not constitute a buy or sell signal.
Instead, the stock’s failure to continue to accelerate outside of the bands indicates a weakening of its strength. This would be a good time to think about scaling out of a position or getting out entirely.
Bollinger Bands Squeeze
Another trading strategy is to gauge the initiation of an upcoming squeeze. This Bollinger Bandwidth formula is simply (Upper Bollinger Band Value – Lower Bollinger Band Value) / Middle Bollinger Band Value (Simple moving average).
The idea is to use daily charts, and when the indicator reaches its lowest level in 6 months, you can expect the volatility to increase.
Snap Back to the Middle of the Bands
This strategy is for those of us that like to ask for very little from the markets. The key to this strategy is waiting on a test of the midline before entering the position. You can increase your likelihood of placing a winning trade if you go in the direction of the primary trend, and there is a sizable amount of volatility.
Success With The Bollinger Bands Strategy
Next, we will present how a basic Bollinger Band strategy will help you make profits. By looking at a real-time trading situation, we will assess Bollinger Band buy and sell signals. We can see that a strong downtrend in market momentum forced prices below the lower Bollinger Band.
This move created our initial buy signal as prices began to trade outside of the 95% containment region. Additionally, the price broke above the midline to further justify the buy signal.
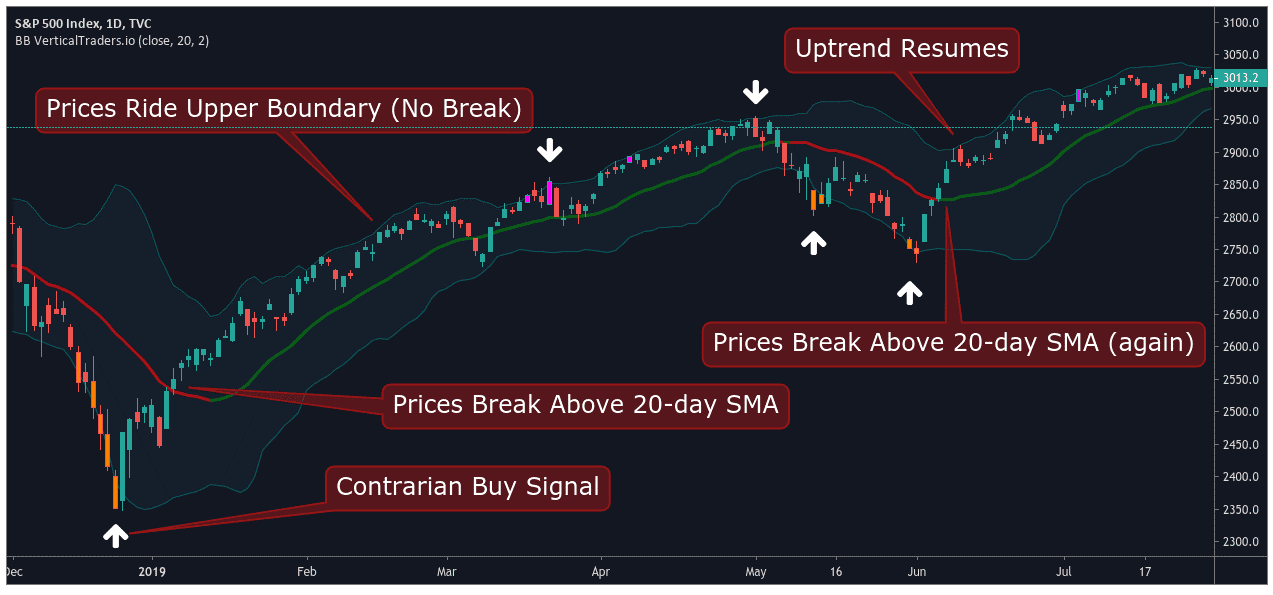
Next, we can see that valuations move sharply higher to reach the Bollinger Bands’ upper boundary. This occurs without market prices breaking above the upper boundary signalling that markets have not become overbought. Therefore, the current rally remains sustainable within the 95% containment zone).
From here, markets continue moving higher. Eventually, the reduced liveliness in the markets constricts the Bollinger Band structure, and price falls below the 20-day SMA mid-line. This is a minor signal which suggests bullish momentum is beginning to weaken.
Thus, it is not surprising to see a sell signal quickly developing – the first downward arrow on the chart. The market prices then finally breach the upper band. At this stage, traders are left with an important decision to make. Is it time to close the trade or continue with the underlying bull position?
Of course, these types of questions are determined by individual risk tolerance. A conservative trader might decide to collect profits given the substantial gains that have already been made. A more aggressive trader might choose to stay in the long trade and chase more significant profits. When prices bounce from this line, it gives us additional evidence that the upward trend is still in play.
From here, the price continues moving higher until valuations breach the upper band once again – the second downward arrow. On this second break, the trend has reached its end, which is apparent when prices ultimately fall below the 20-day SMA. All signals to close the long trade have been generated at this stage, and a trader is advised to collect profits.
Double Bollinger Bands Strategy
In the second example that we will present, we will witness the Double Bollinger Bands’ trading strategy’s efficiency. This strategy allows you to trade Bollinger Bands in ranging markets. For this reason, traders often use a Bollinger Bands Forex Strategy.
Double Bollinger Bands strategy advises you to enter long trades when price breaks below the lower standard deviation and vice versa. This way, you will be trading Bollinger Bands on both sides of the market.
On the left part of the chart, gold prices have fallen sharply through the lower band. A buy signal is generated at $1,490 as prices are now expected to move higher in the short term.
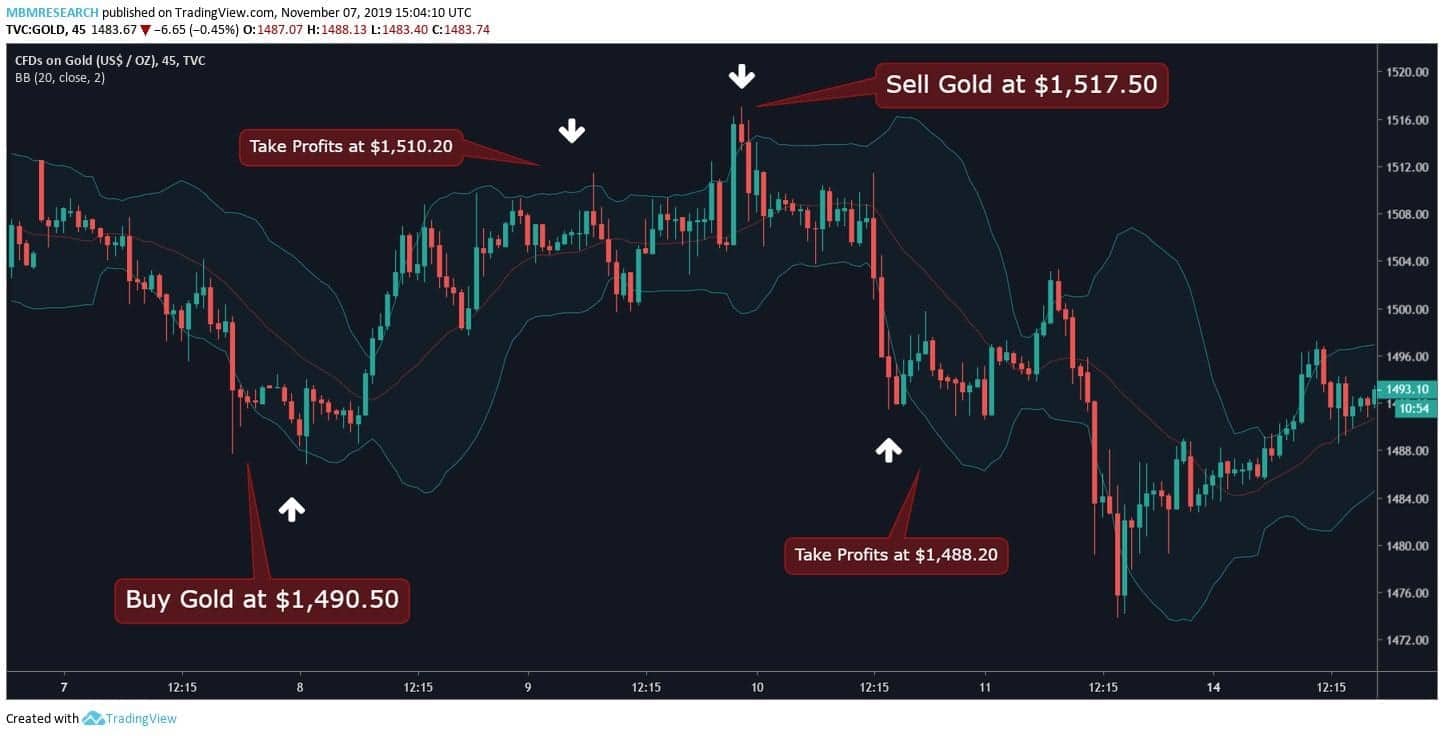
Stop losses for the trade can be set at $1,486.50, and this allows us to set a profit target at $1,510.20. These trading parameters will enable us to keep a favourable risk-reward ratio of at least 3:1. Shortly afterward, our target is reached.
Tips for Bollinger Bands Trading
- The Bollinger Bands provide a relative definition of high and low.
- The relative definition can compare price action and indicator action to arrive at rigorous buy and sell decisions.
- The price can, and does, walk up the upper Bollinger Bands and down the lower Bollinger Bands.
- Volatility and trend have already been deployed in the Bollinger Bands construction, so their use for confirmation of price action is not recommended.
- The indicators used should not be directly related to one another. For example, you might use ‘one-momentum’ or ‘one-volume’ indicators successfully, but two-momentum indicators aren’t better than one.
- Appropriate indicators can derive from momentum, volume, sentiment, open interest, inter-market data, etc.
- The Bollinger Bands can also be used to clarify pure price patterns such as M-tops and W-bottoms, momentum shifts, etc.
Bollinger Bands in Cryptocurrency Trading
Additionally, you can also use Bollinger Bands as one indicator that can help your trading journey in the cryptocurrency market.
This indicator still serves the same purposes as it does in other financial instruments, which is to indicate volatility in an asset’s price. Ultimately, you can closely observe the contraction and expansion between the lower and upper Bollinger Bands.
One of the core ideas in using Bollinger Bands in crypto trading is what is called the squeeze. The squeeze occurs when the bands move closer together, which is considered a sign of increased volatility and new trading opportunities.
On the other hand, when Bollinger Bands move further apart, this often means lower volatility — a sign that it may possibly be time to exit a trade.
In many cases, it is important to understand that when a price hits the respective Bollinger bands, this does not indicate oversold or overbought conditions.
Thus, it is best for you to develop your cryptocurrency trading strategies using Bollinger Bands, moving averages, the RSI, and oscillators. While a combination of indicators will not necessarily provide perfectly accurate reversal points, they can narrow down the potential reversal points.
How To Read Bollinger Bands
Bollinger Bands generate different values that change with movements in the underlying market value of the asset. In other words, when the market activity becomes more volatile, the bands will spread farther apart. When market activity slows, the indicator will contract.
Bollinger Bands trading is mainly centred around analyzing the strength of trends. In general, during strong trends, price action usually stays close to the outer band. Oppositely, the momentum is waving if the price pulls away from the outer band as the prevailing trend continues.
Of course, Bollinger Bands trading should not be thought of as a stand-alone system. Instead, it can provide market traders with necessary information regarding the potential price volatility of an asset.
For this reason, expert traders will often use this technical indicator in conjunction with another indicator. Moving Average Convergence/Divergence (MACD) and Relative Strength Index (RSI) technical indicators are often used to validate Bollinger Bands’ signals.
YOUR CAPITAL IS AT RISK
How Are Bollinger Bands Calculated?
Defined as a degree of positive or negative price variation over time, volatility is generally measured through standard deviation. The typical Bollinger Band standard deviation measures the distance between current asset prices. It then compares that value to the average price of the asset over the previous 20 price periods.
To calculate bands, you should first identify a simple moving average. Secondly, you need to add or subtract a specified number of standard deviations from the simple moving average. This produces the values which define the upper and lower bands.
How To Use Bollinger Bands
Roughly 95% of all price action is expected to occur between the upper and lower Bollinger Bands. For this reason, the Bollinger Band strategy is ideal for ranging market conditions.
This technical indicator shows price extremes that are likely to contain market activity. Thus, any breakout above or below the boundaries represents a significant event in the market.
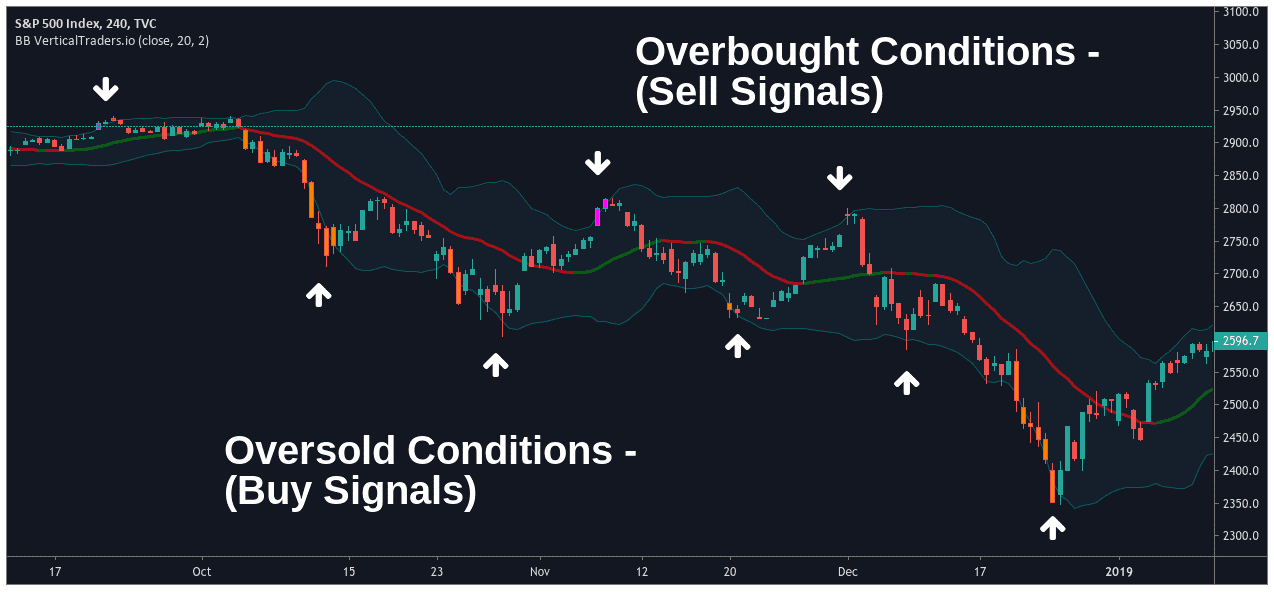
As a result, prices rising above the upper band indicate overbought markets and generate a sell signal. Conversely, prices falling below the lower band indicate oversold markets and issue a buy signal.
These signals are further strengthened when prices fail to close above/below the Bollinger Band envelope and leave a long candlewick. This represents an additional (confirming) signal indicating that a potential reversal in the price direction is about to take place.
Therefore, some traders use Bollinger Bands to identify reversal points. This strategy is also called a “contrarian Bollinger Band strategy.”
Summary
- Bollinger Bands is a popular technical indicator used to interpret the strength of a trend and identify market tops or bottoms;
- During strong market trends, asset prices remain close to the outer Bollinger Bands (upper or lower);
- When prices reach an outer Bollinger Band and pull back, the market is showing fading trend momentum;
- Price movements below the lower Bollinger Band generate a buy signal and vice versa.
PEOPLE WHO READ THIS ALSO VIEWED:
- Here are our latest trending stories
- Learn gap trading strategy


