
The V-top pattern gets its name from the upside-down V shape formation and appears when price momentum switches from an aggressive buying to an aggressive selling state.
This pattern is a powerful bearish reversal chart pattern and appears in all markets and timeframes but due to the nature of the fast sell-off that follows, it can be difficult to identify this pattern until it’s completed.
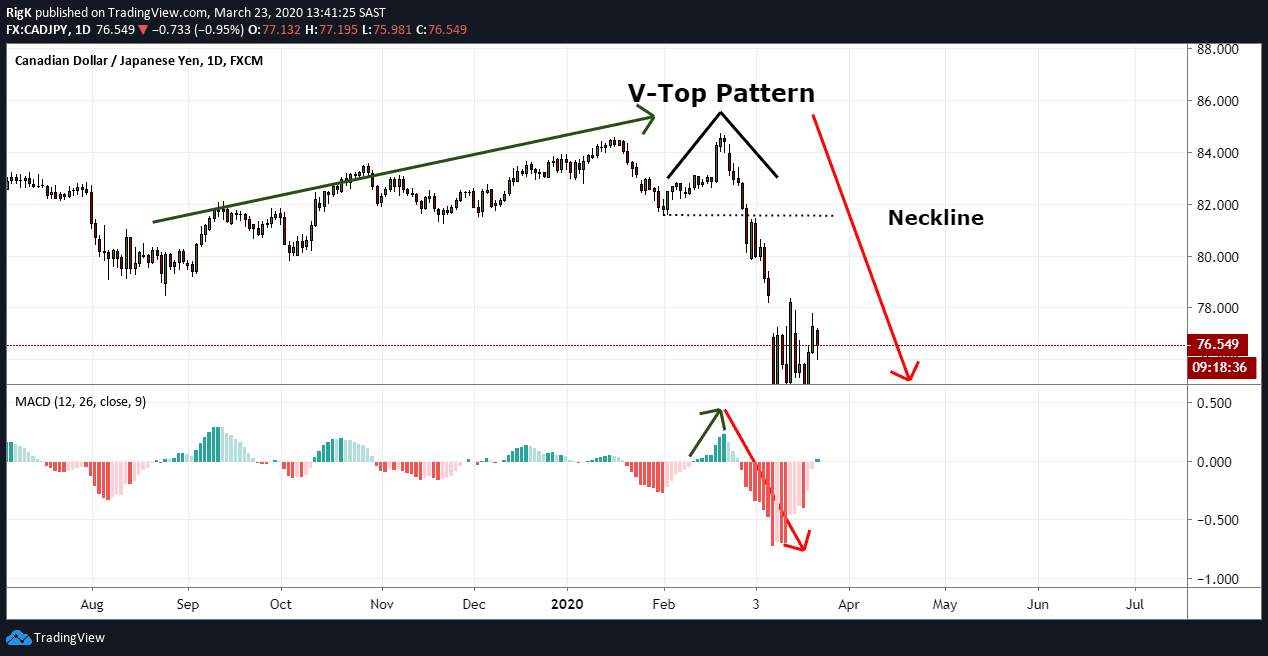
The chart above shows a V-top at the end of a correction. Price traded higher and immediately reversed lower with a massive increase in momentum. It is nearly impossible to predict V-tops, but most traders will wait for price to break the neckline of the pattern and then enter a short position once price retests the neckline. However, the sell-off can in some cases be so strong that you will not get a retest of the neckline and it is therefore recommended that you do not attempt to chase the market.
Traders Tip: Early indications that a V-top is taking place would be the presence of a 1-3 bar reversal accompanied by an increase in volume during the upswing and the immediate downswing.
How to Trade the V-top
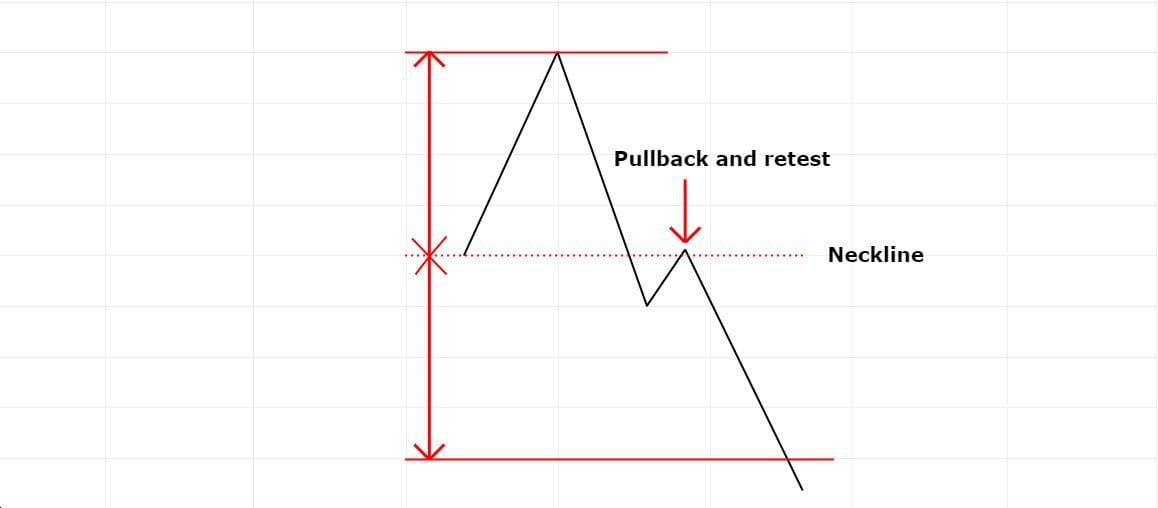
There are probably many ways to trade the V-top, but the most conservative way would be to wait for a break and close below the neckline and to attempt a short once price pulls back to the neckline and gets rejected.
An ideal target can typically be set below price by measuring the same distance from the top of the pattern to the neckline low.
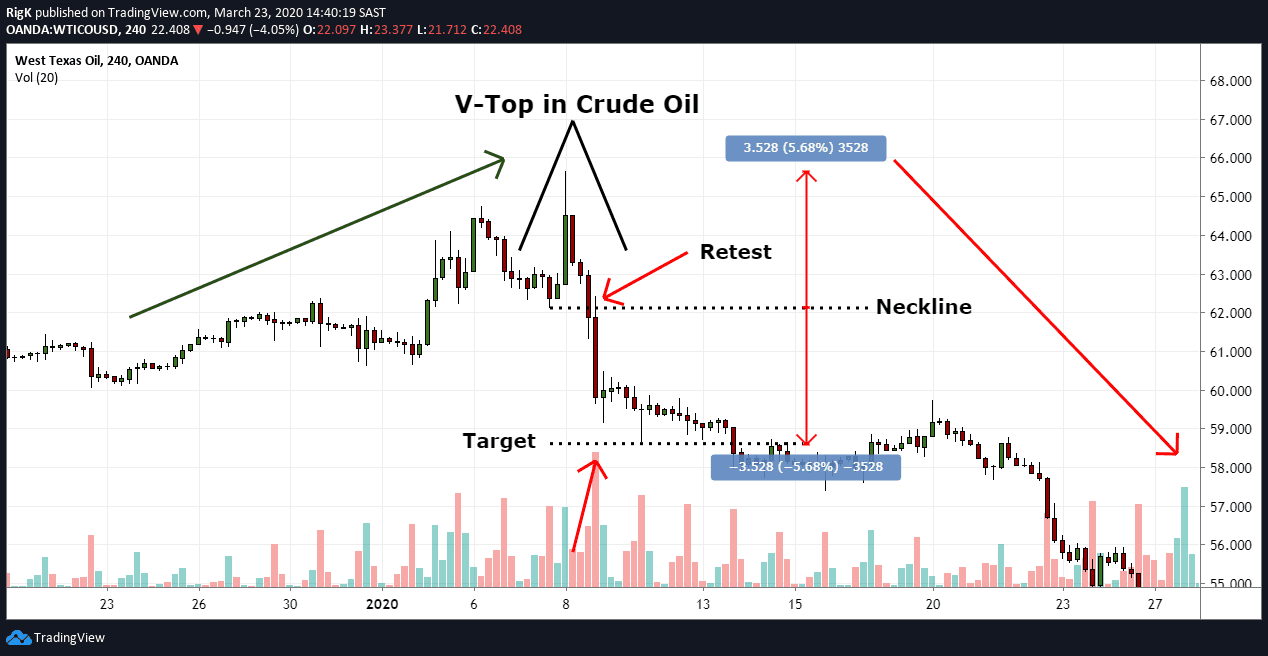
The final chart above shows a great example of a V-top pattern in Crude Oil. Price made the last push higher with a long-ranging bar and decent volume but immediately afterward price reversed lower with a strong increase in volume.
After price closed below the neckline, there was a slight pullback to the neckline before price sold-off further. This example also shows how a target could have been set using the same distance from the V-top to the bottom of the neckline and projecting it lower.
Trading V-tops can be difficult because you will more than likely only recognize this pattern once price breaks below the neckline but if you keep an eye on momentum and volume, then they can provide you with the clues necessary to how these patterns tend to behave.
Some markets like Crude Oil, for example, are greatly affected by geo-political influences and when traders react to these events you will quite often find these V-shaped formations.
PEOPLE WHO READ THIS ALSO VIEWED: