

Key points:
- Risk Assets Dump and Pump Through US CPI Release
- Bullish Crypto Chart Signals
- BTC Bullish Forecast, ETH Positive Price Projection
Global risky assets saw significant losses in reaction to the release of the latest consumer price index data from the US on Thursday, then posted robust recoveries. This bullish price action could have signalled significant short-term and possibly intermediate-term turning points for many asset classes, including many of the major crypto currencies. The outlook for Bitcoin (BTC) and Ethereum (ETH) is looking more positive.
Risk Assets Dump and Pump Through US CPI Release
On Thursday the U.S. Labor Department reported that the Consumer Price Index (CPI) for September slowed from the prior month, but the inflation rate was still faster than the consensus from economists. Overall CPI increased 0.4% last month, up 8.2% from a year earlier. The core CPI (excluding food and energy) rose to its highest level since 1982, up 6.6% from a year ago. The month-on-month data for core CPI climbed 0.6% for a second month.
The initial market reaction to this data release was “risk off”, producing a sell-off across riskier financial assets, with stocks, cryptocurrencies and oil all lower. Even the safe havens of US Treasuries and gold were lower (gold has been trading in line with stocks recently, given its inverse relationship to the US Dollar). The US Dollar posted a strong rally.
However, these markets then posted very significant turnarounds, with the S&P 500, for example, wiping out a 2.4% loss for the session to close 2.6% higher for the day. Thursday saw the fifth-largest intraday reversal from a low in the history of the S&P 500 and the fourth-largest for the Nasdaq.

Also Read: Top 10 Crypto Investors To Follow On Twitter
Bullish Crypto Chart Signals
Cryptocurrencies joined the party with global risky assets, initially plunging lower, then staging strong intraday rebounds. From a charting perspective, this produced various bullish candlestick, mostly positive Hammer and Dragonfly Doji patterns on the daily charts. From a technical analysis viewpoint, these patterns often signal at least a short-term turning point, but given the extreme nature of some of the intraday reversals, plus given the intermediate-term positive basing patterns already seen across cryptocurrencies, the strong risk is that Thursday’s price action could have signalled a major, bullish turning point and bottom.
BTC Bullish Forecast, ETH Positive Price Projection
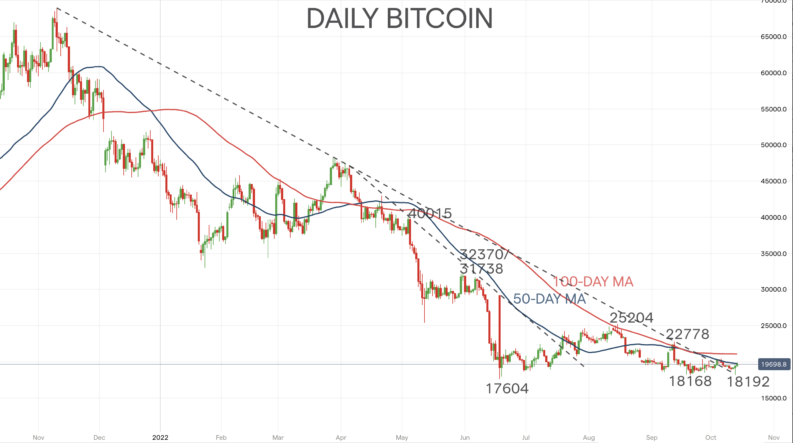
A bullish daily Hammer candlestick for BTC, holding just above the latter September low at 18168, at 18192. This positive price action reinforces the intermediate-term bottoming pattern we have previously highlighted, and keeps the risk for October and the balance of 2022 higher. The October bias is to test the 22778 September peak, with a threat as high as 25204. The year-end risk is to possibly even target 31738/ 32370 chart resistances.
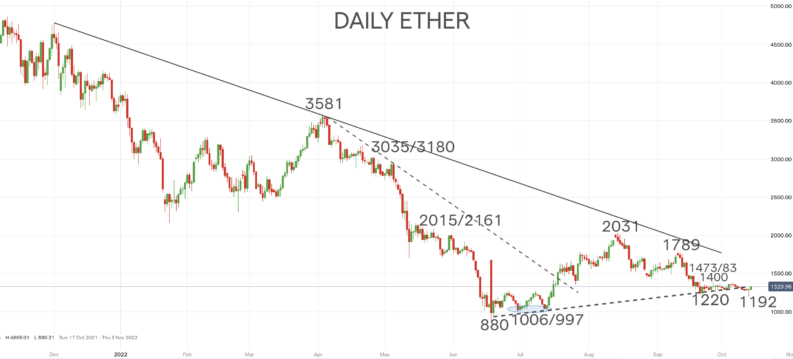
Ether also reinforced the intermediate-term base we reported on recently, with a Dragonfly Doji daily candlestick from a new recent setback low at 1192 (from below the 1220 September low). ETH has, therefore, rejected the threat of a more bearish extension and built on the intermediate term basing from June. Upside risks remain to 1400 and 1473 chart resistances from September, maybe 1789 into latter 2022.
