
Key points:
- Ether Is Challenging, But Holding Intermediate-Term Support
- This Keeps the Bottom Pattern From June Intact
- Upside Forecasts
Although Ether (ETH) has been in a holding pattern since latter September, the positive tone to this consolidation phase reinforces the intermediate-term basing pattern from the bear market low from June 2022. This leaves an underlying bullish bias from both a short- and intermediate-term viewpoint , leaving the risks for more positive ETH price action for October and into year-end.
Ether Is Challenging, But Holding Intermediate-Term Support
Also Read: What Is the Crypto Fear and Greed Index?
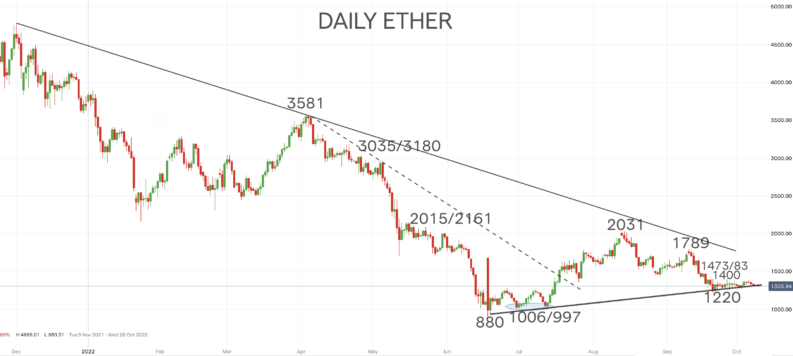
Ether has been in a positive, but somewhat sideways range phase since the mid-September lows was posted at 1220. Moreover, the current price action has seen a succession of modestly higher highs and higher lows since this low was posted. Furthermore, the market is currently probing at the basing trend line that is drawn off of the June and July swing lows at 880 and 1006 but rejecting a decisive break below this intermediate-term trend/ bottoming support factor.
 WELCOME BONUS - Free Share Bundle When You Invest £50!
Get up to £500 cashback for investing with IG.
WELCOME BONUS - Free Share Bundle When You Invest £50!
Get up to £500 cashback for investing with IG.
This Keeps the Bottom Pattern From June Intact
Whilst holding above this trend support and, more significantly the 1220 swing low, we see positive technical set-ups for ETH in both the short- and intermediate-term. Whilst above these supports, the June-August recovery up to 2031 through multiple bear market resistances has secured a more sustainable base and recovery for October and into year-end.
Upside Forecasts
Whilst above 1220, we see October upside risk to chart resistances from September at 1400 and 1473. Overshoot risk for Ether for the month is as high as the September failure peak at 1789. Into year-end, the threat is still higher to maybe challenge the August swing high at 2031 and even to May bear market resistance at 2161.
Below 1220 would target 1006/997 and then the bear market low at 880.
