

Key points:
- Ethereum Merger Countdown
- ETH Chart Outlook – Basing?
- BTC, Bullish Or Bearish?
Another important step was taken this week in the Ethereum move from a Proof-of-Work (PoW) to Proof-of-Stake (PoS) system, which would see power usage plunge in block mining. We look at this development in more depth, as well as revisiting the current market position for Ethereum (ETH). Plus, we look at the up-to-date Bitcoin (BTC) chart.
Ethereum Merger Countdown
The Ethereum Network is one step closer to achieving its goal of becoming the new home for decentralized applications this week. Ethereum’s ninth shadow fork went live on Wednesday, marking one of the final steps in an important milestone on the path toward transitioning from Ethereum 1.0 into Ethereum 2 (ETH2).
The concept of a shadow fork is to focus on one or two smaller functions, with this fork examining Ethereum’s feature of “maximal extractable value” (MEV). This comes ahead of the next testnet Merge, Goerli, which should be the third and final merge, which is anticipated to be in August. The Merge would transfer the blockchain from operating as a PoW to PoS, a critical step to drastically reduce power consumption. According to Ethereum.org, the Merge will reduce Ethereum’s energy consumption by ~99.95%.
Also Read: How Will Cryptocurrency Perform During A Recession?

Tim Beiko of the Ethereum Foundation, who arranges meetings of the network’s core developers, has proposed 19th September as a target date for the Merge in a Tweet on Thursday.
ETH Chart Outlook – Basing?
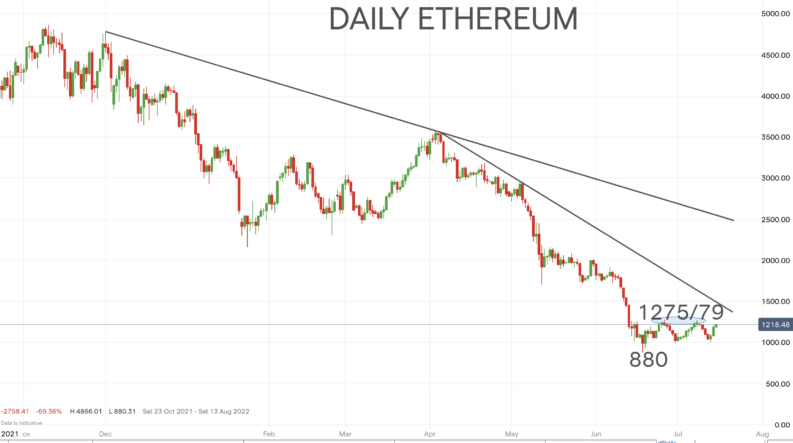
Consolidation continues to be the dominant theme since the mid-June spike down to 880 as the crypto winter was dealt another chill with the liquidation troubles for crypto hedge fund Three Arrows Capital (3AC). Above 1275/79 is needed to secure a bottoming pattern and preferably up to reverse through the downtrend line from April (currently 1500). A push down below 880, however, quickly sees the threat down to 725, with a risk down to a far deeper target at 311!
BTC, Bullish Or Bearish?
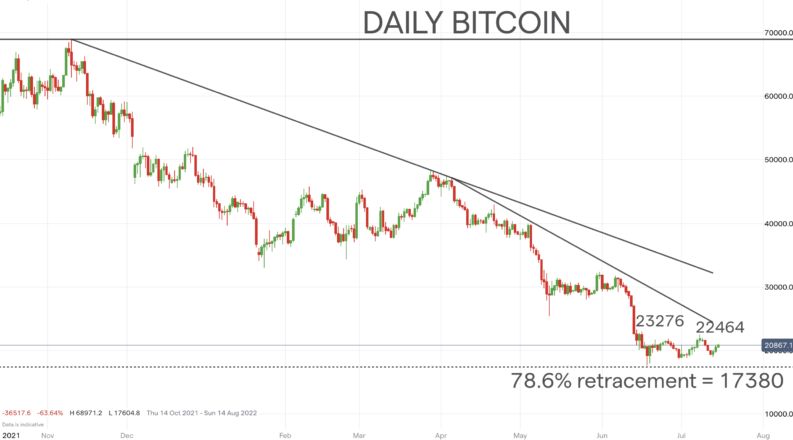
The June plunge saw Bitcoin hold just above a critical level, the 78.6% Fibonacci retrace of the entire 2019-2021 bull rally, at 17380. Since then, consolidation above here has established a possible basing pattern, helped by the recent July push above the 21864 level up to 22464. However, a better recovery above this new resistance and 23276, plus through the downtrend line from April, would reinforce the recovery outlook. But, down through 17380 would encourage a more forceful breakdown.
