The Rising Wedge Pattern Explained
The rising wedge pattern is a very common formation that appears in any market and timeframe. This chart pattern can be seen as a bearish reversal pattern after an uptrend or as a trend continuation pattern during a downtrend.
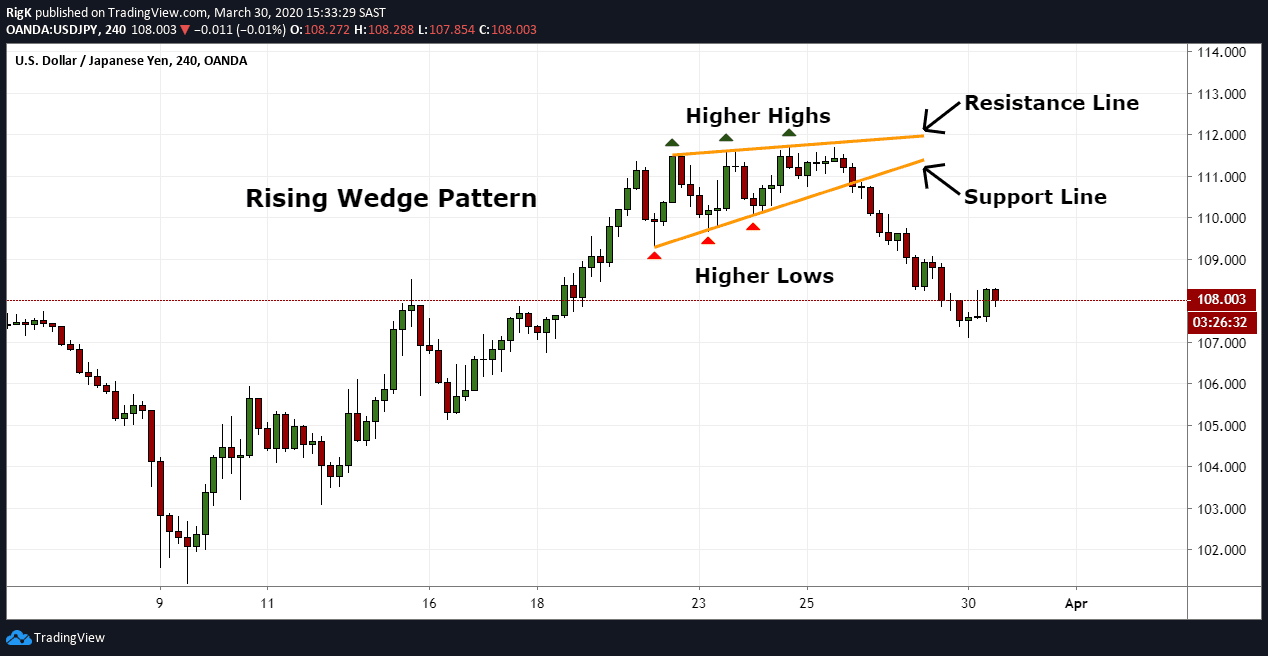
A rising wedge can be defined by a set of higher lows (support) and higher highs (resistance) that slope upwards and contract into a narrower range before price finally breaks below support and a change in trend direction occurs. Another notable characteristic of a rising wedge is that the lower support line has a steeper ascending angle than the upper resistance line.
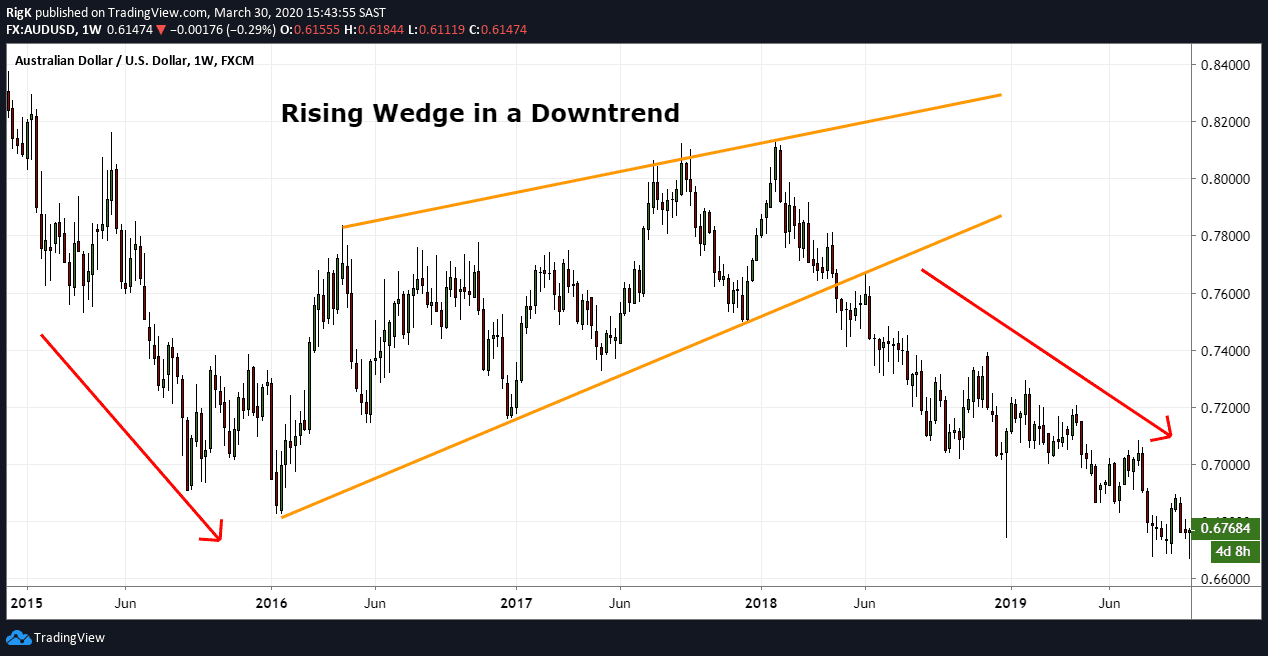
Here is another chart example of a rising wedge that formed during a downtrend in the AUD/USD forex pair and which lasted for more than two years before the pattern came to an end and the previous downtrend resumed.
How to Trade the Rising Wedge Pattern
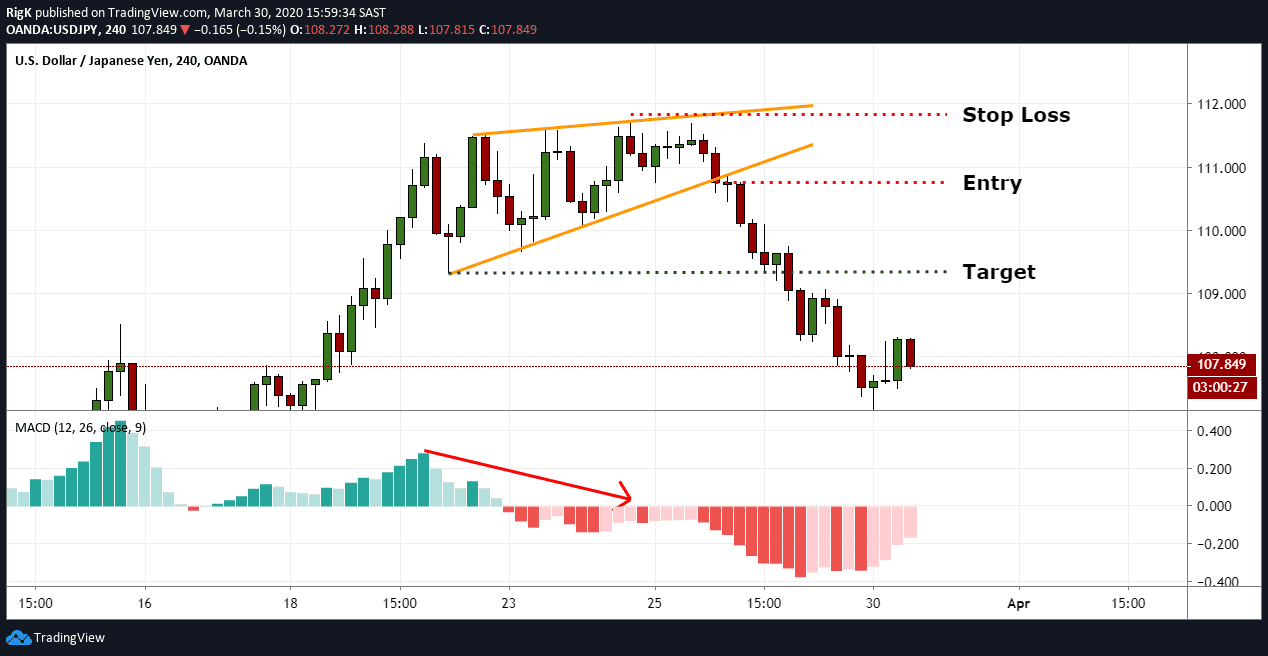
Since the rising wedge is a bearish pattern, aggressive traders will typically wait for price to break below the lower support line before they will execute a short position. Conservative traders, on the other hand, will generally wait for price to retest the lower support line from below before they will execute a short trade. Just keep in mind though, that this may not always happen and result in a trader missing an entry.
The ideal place to set a target will be at the lower level where the rising wedge started from, with a stop loss a few pips above the final high before the breakout occurred.
Traders Tip: When you are following a rising wedge in real-time, it can be a good idea to watch for momentum divergence on a MACD-Histogram between the higher highs, and use it as an additional confirmation method that a rising wedge might be nearing an end.
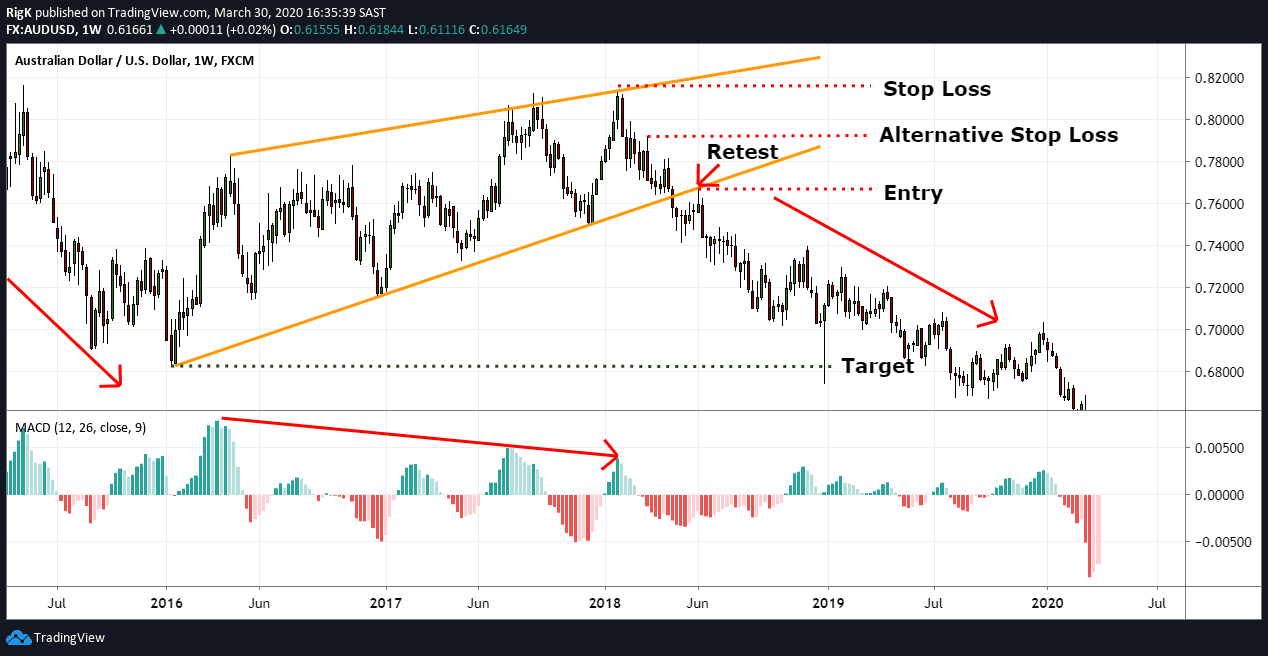
My final chart shows that same multi-year rising wedge that formed in AUD/USD but note that although price made higher highs that the momentum between each peak started slowing down, which is a behavior that these patterns tend to display.
This is also a picture-perfect example where price pulled back to the support line, retested it from below and dropped lower. A target could again have been placed at the level where the rising wedge started from with a stop loss above the last higher high.
Always make sure that your potential reward is larger than the risk you are taking on and if your stop loss ends up being too far away, then consider placing your stop above a previous swing high that was formed on the way down, before the support line was broken.
The rising wedge pattern is a bearish pattern, whether it forms after an established uptrend or during a downtrend, so the next time you spot this pattern on your favourite market exercise caution if you are holding a long position or prepare for an opportunity to get short.
PEOPLE WHO READ THIS ALSO VIEWED: