

Key points:
- Fidelity Ethereum Index Fund
- Ether Chart Analysis
- Ether Price Forecast
Fidelity Ethereum Index Fund now has $5 million invested in it as Fidelity are rumoured to be looking at offering cryptocurrencies to its retail customers. With this in mind, we look at the Ether (ETH) chart, provide analysis and price forecasts.
Fidelity Ethereum Index Fund
In further evidence of cryptocurrency investing moving into the mainstream registration documents filed with the U.S. Securities and Exchange Commission (SEC), highlight that Fidelity’s new Ethereum index fund has $5 million invested in it. The market-leading asset manager, noted that the first sale took for the Fund occurred on 26th September, although the fund was registered its on Tuesday, according to the SEC filing.
This positive development for the cryptocurrency industry comes in the wake of last month’s rumour from the Wall Street Journal, that Fidelity was planning to allow individual investors to trade Bitcoin (BTC) on its brokerage platform.
Ether Chart Analysis
Also Read: Ethereum for Beginners

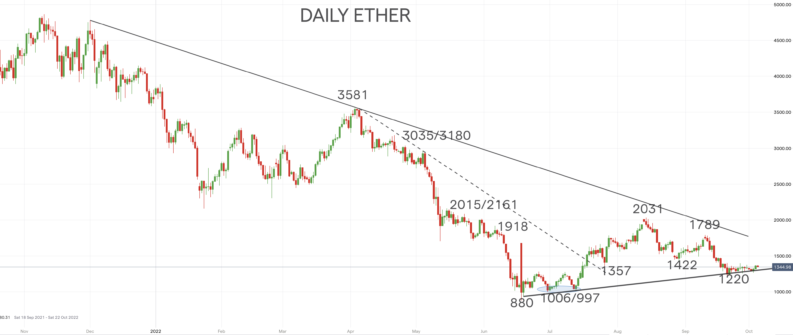
Despite falling in price since the completion of the Ethereum Merge on 15th September, Ether has been in a holding phase, since a low was posted on 21st September at 1220. During this consolidation period, a modest succession of higher highs and higher lows on the daily chart highlights a positive range environment in the very short-term.
This price action is seen as an attempt to try to reject the more negative theme evident after the release of the US CPI data in mid-September. The sell-off from 1789 saw ETH surrender swing supports from early September and also July at 1422 and 1357, down to 1220.
But the prior June-August rally up top 2031 had indicated a bigger, intermediate-term basing pattern and this points to a renewed recovery theme into October and year-end, whilst holding above 1220.
Ether Price Forecast
Whilst 1220 is intact as a support foundation, we see both a short-term rebound bias and an intermediate-term recovery theme as intact for ETH. The October threat is still for more positive price action, to aim up for the September peak at 1789 and potentially the August recovery cycle high at 2031. Bigger picture, for year-end the overshoot threat is still higher, maybe close to 3035/3180, although this is an ambitious target.
But an Ether break below 1220 would signal a more negative tone and target 1006/997 supports and then a move lower closer to the bear market low at 880. Surrender here would then open the door to a far more bearish extension below.
