- Prices of safe-haven assets have been ‘crushed’ as the financial markets make a more optimistic interpretation of the risks facing the global economy.
- Gold prices have hit three-month lows and the weekly performance looks like showing the biggest fall for two years.
- More cautious investors with hedges against market weakness are left taking cover.
Gold has spent most of the week in a downward trading pattern and looks set to end Friday’s session printing around the $1,460 level.
XAUUSD 30 minute candles — 31st October – 9th November 2019:
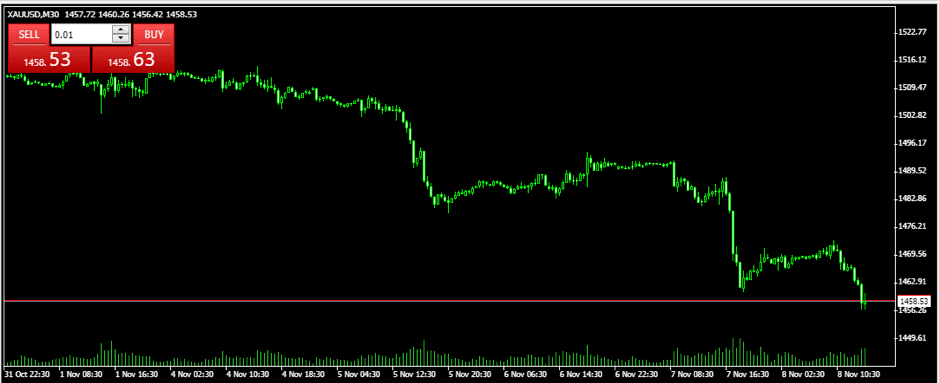
The weakness right into the tail end of the week’s trading has taken prices to five-week lows. The significant support level of 1458.88 marked the low point of trading on 1st October, but Friday’s trading has seen MetaTrader’s XAUUSD ticker touch new lows of 1456.26 on an intraday basis.
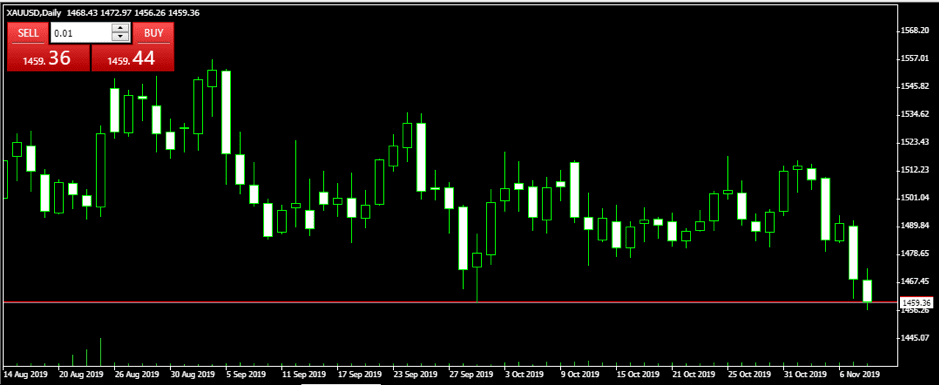
XAUUSD Daily candles — 14th August – 9th November 2019:
Goldbugs are feeling the aftershocks of a rally in equities as investors rotate out of safer positions and take more risk on their book. Global equity indices including the S&P 500 and Dow Jones Industrial Average (DJIA) have this week posted all-time highs on the back of speculation that the US and China are due to sign off on a trade deal. The catalyst for downward movement in gold was then followed up by momentum-orientated short-selling as gold prices broke through technical support levels.
XAUUSD daily candles — 14th August – 9th November 2019 — with stochastic oscillator:
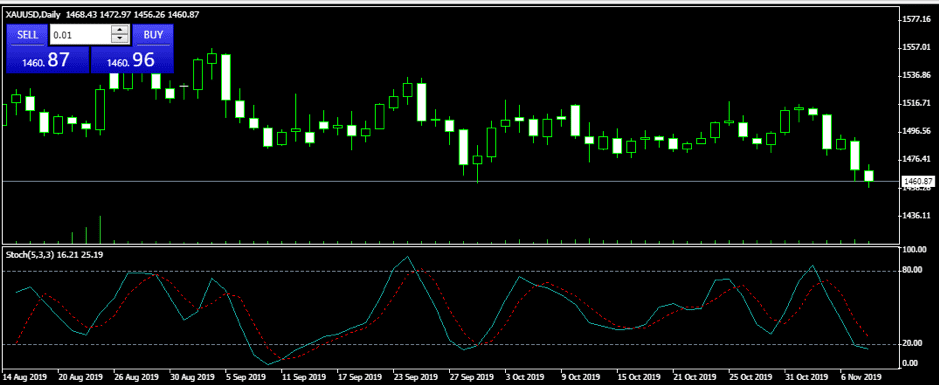
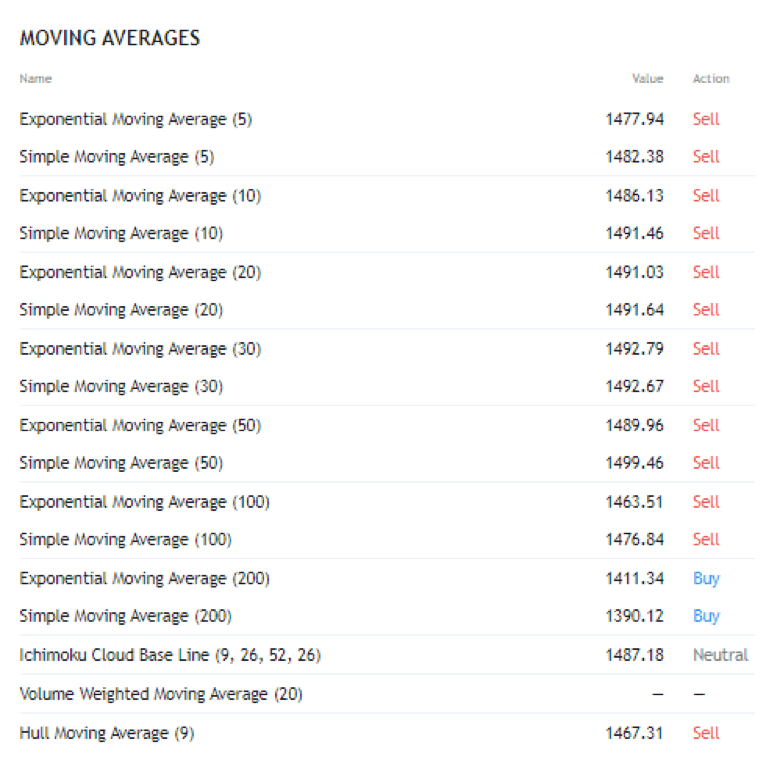
The daily technicals have taken on a bearish tone. The performance since Monday is setting gold up for its biggest weekly loss in two years. Some strength and a retracement of the downward pattern may come from the market becoming oversold, but that may only result in a consolidation pattern. There appears little in the way of catalysts for the metal to rally, and as it is currently trading below the 100 DMA ($1476) and daily cloud base ($1478), there is hope, and scope, for the bears looking to drive prices lower.
The dashboard of TradingView’s ‘Technical’ section on Gold CFDs (TVC:GOLD) confirms that the Oscillators and MAs they apply are pointing to the short side.
TradingView — Tech Analysis Dashboard:
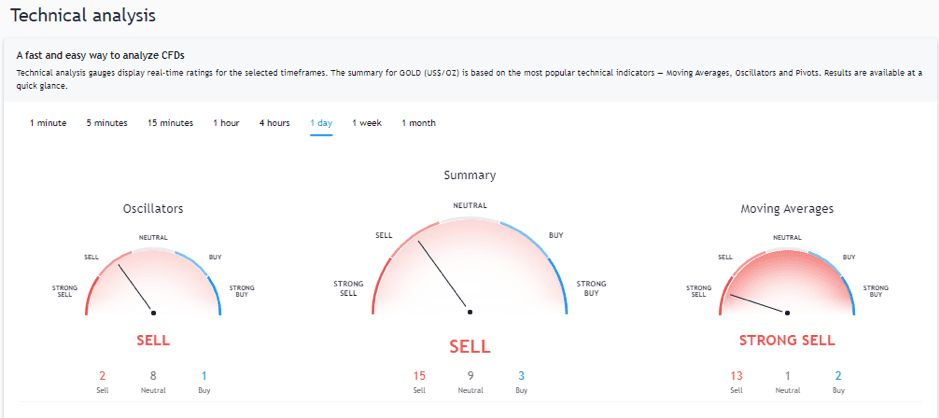
Gold has rallied from $1,280 in June and shown considerable strength to hold near the $1,500 mark, despite a range of pressures. But now, that work by the bulls looks to be unravelling as it trades below all the averages for time Daily periods up to the 200 MA mark.
TradingView technicals — moving averages:
How low can you go?
The factors that have caused the price shift in gold could have some way to go.
Gold trading at $1,460 appears to reflect a level that could be broken — should ground-breaking terms be agreed by the US and China. This is certainly a possibility that can’t be ruled out.
The bond markets have also seen yields widen. Reuters reported on Tuesday:
“Most other 10-year euro zone bond yields were 2-3 bps higher on the day, while US Treasury yields rose 3 bps to 1.82%”
Source: Reuters
The benchmark US Treasuries have started to show signs that traders are reducing the likelihood of a recession and even a pick-up in interest rates. Both of these factors are bad for the price of gold. The lower risk of recession appears to be drawing capital away from havens and into equities. The low-interest rates have been a major driver of higher gold prices as the opportunity cost of holding the metal has been reduced by there being such minimal returns on cash held at banks.
Still hope?
The US is yet to make an official announcement regarding how the talks have progressed. This elephant in the room may be explained away by the preference being for President Trump to be the mouthpiece of any good news. He would accordingly want to ensure any claims made don’t backfire at a later date. Talks between the US and China do indeed have a track record of falling down at the last minute. So, the absence of a US update suggests there is still work to do on agreeing ‘phase 1’ of the process. Even if the US does come out over the weekend to corroborate the Chinese comments, it does appear unlikely that any agreement will cruise to the finish line.
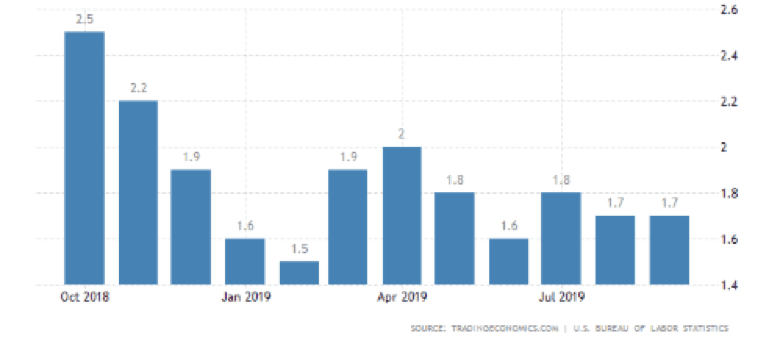
The indication given by the bond markets that there will be a return to rising interest rates is based off the interpretation of the situation by the markets rather than any particular course of action being taken by central bankers. Jerome Powell and the US Fed have cut interest rates at the last two meetings of the FOMC committee. They have also stated that the metric they give most precedent to is the inflation rate. Keen on avoiding a reputation for being ‘flip-floppers’ the FOMC appears happy with rates where they are until inflation picks up. Powell himself gave guidance on 30th October when he said that the Fed would need to see a “really significant” rise in inflation before hiking rates (source: CNBC)
US Inflation — CPI:
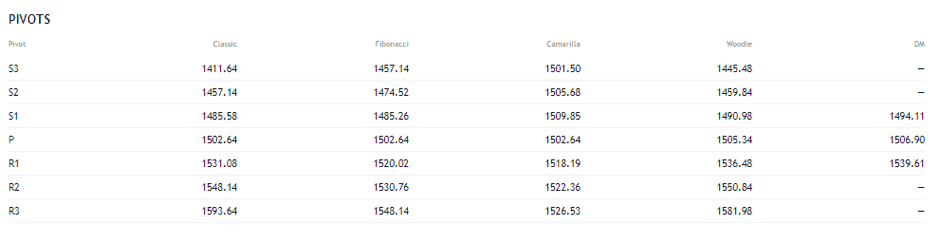
From a technical perspective, the 200 Daily MA is some way off at $1,411.34 and S3 support level is at $1,411.64. That means there is a lot of further room in which Bears can make profits but some considerable resistance when price gets to the $1,411 area. The S2 Support Level (daily) is at $1,457.14. This may not prove to be too much of a barrier. The markets are now well-rehearsed in taking snippets of good news and moving into riskier assets.
Technicals — daily pivot points table:
The reality is that for gold prices to recover, there is a need for a fairly serious geopolitical jolt. As ever, even the most optimistic traders will accept this will ultimately come, the immediate question is when?