
The Gartley Pattern is one of the most popular harmonic patterns and can be used across many markets in multiple timeframes. The Gartley pattern is a 5-point pattern, that has Fibonacci measurements that are used to generate each point. The Garley pattern can be either bullish or bearish. The 5-points are:
- XA Impulse Leg
- AB which is a 61.6% retracement of XA
- BC Leg which is either a 1.27 projection or a 1.618 projection of XA
- CD which equals AB
- Target1 = 38.2% retracement of AD
- Target2 = 61.8% of AD
- Common Risk Management stop loss just above or below point X
Fibonacci Terms
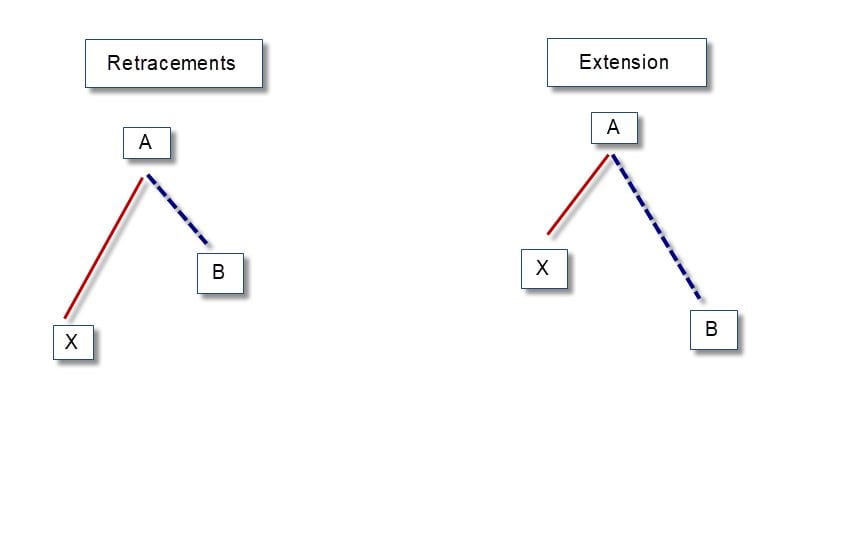
A retracement is a temporary reversal of a trend in the price of an asset. It differs from a reversal, in that retracements are for short periods against the move of the general trend followed by a return to the previous trend. In the picture above line AB is a retracement of the trend that started with XA. What makes a retracement different from a reversal is that the asset that you are evaluating does not breach support or resistance that is created by the uptrend or downtrend. If the price falls below or rises above support or resistance, then the retracement is no longer considered a retracement but a reversal.
An extension helps establish profit targets or estimate how far a price may travel following a retracement. The Fibonacci extension levels are derived from Fibonacci ratios. Fibonacci extensions can be used for any timeframe across all asset classes. Additionally, Fibonacci extensions are a way for you to generate price targets to find areas of support or resistance.
Bullish Gartley pattern
Like all harmonic patterns, the Gartley bullish pattern, has an ABC wave that begins with an impulse wave which is the setup of the pattern.
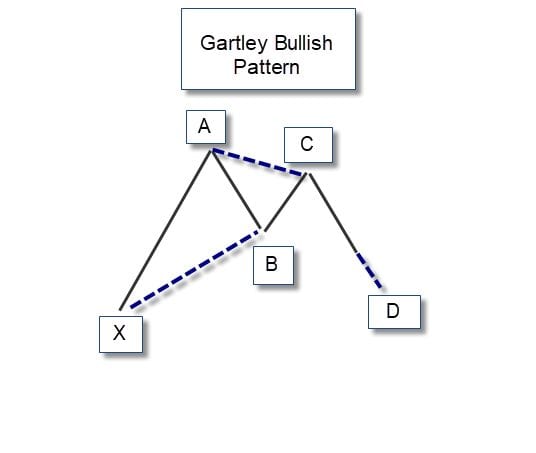
The Gartley bullish pattern begins with an uptrend forming the impulse wave referred to as “XA”, which forms point A. After completing the impulse wave, the price reversed forming Fibonacci retracement AB that is 61.8% of the impulse wave. This can be calculated by multiplying the length of XA by 0.618.
The Price reverses at point B. The BC retracement should be between 61.8% and 78.6% of the AB price range. This is shown as the dashed line AC. At C, price reverses with retracement CD between 127% and 161.8% of the range BC. Point D is the point to enter the market generating a buy range.
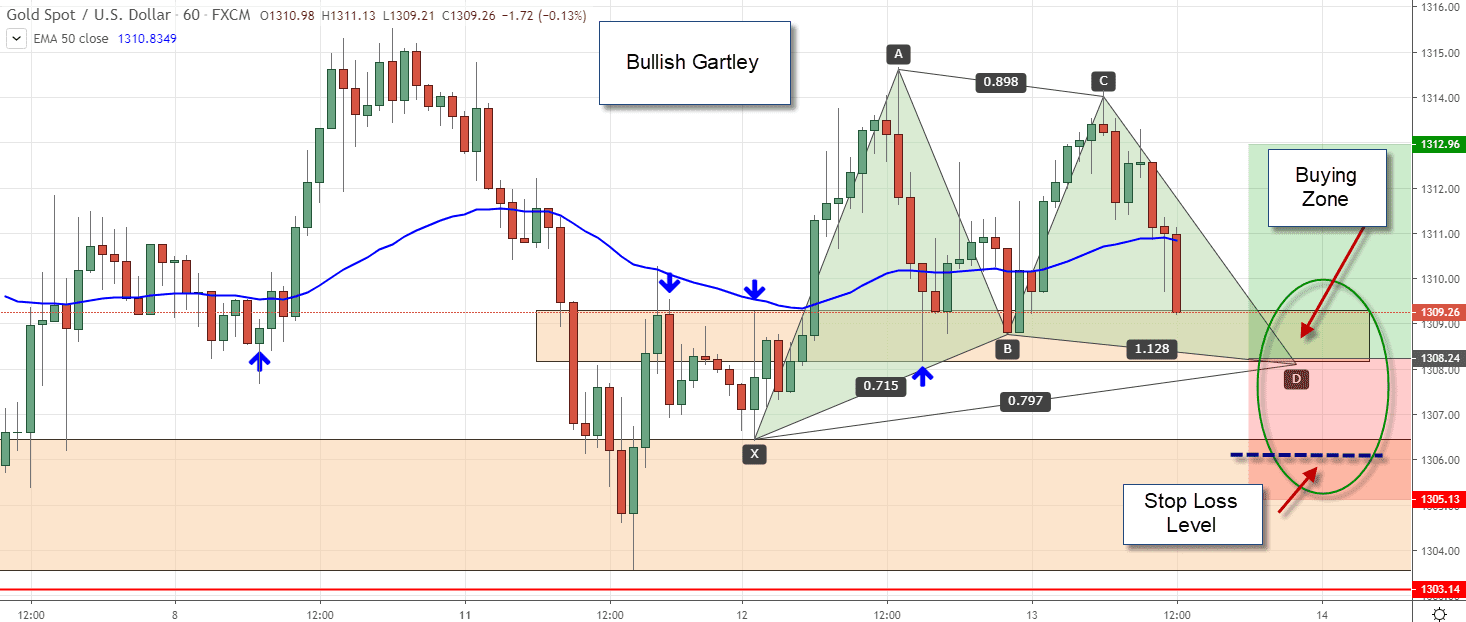
Here is a setup of a bullish Gartley pattern. The target level of D is the potential reversal zone (PRZ), which would be considered a range where you would consider purchasing gold looking for a higher target to take profit. The risk management surrounding this pattern would be to put a stop loss just below point X, where the risk that you take is less than the reward that you expect to receive from gold rising to a target.
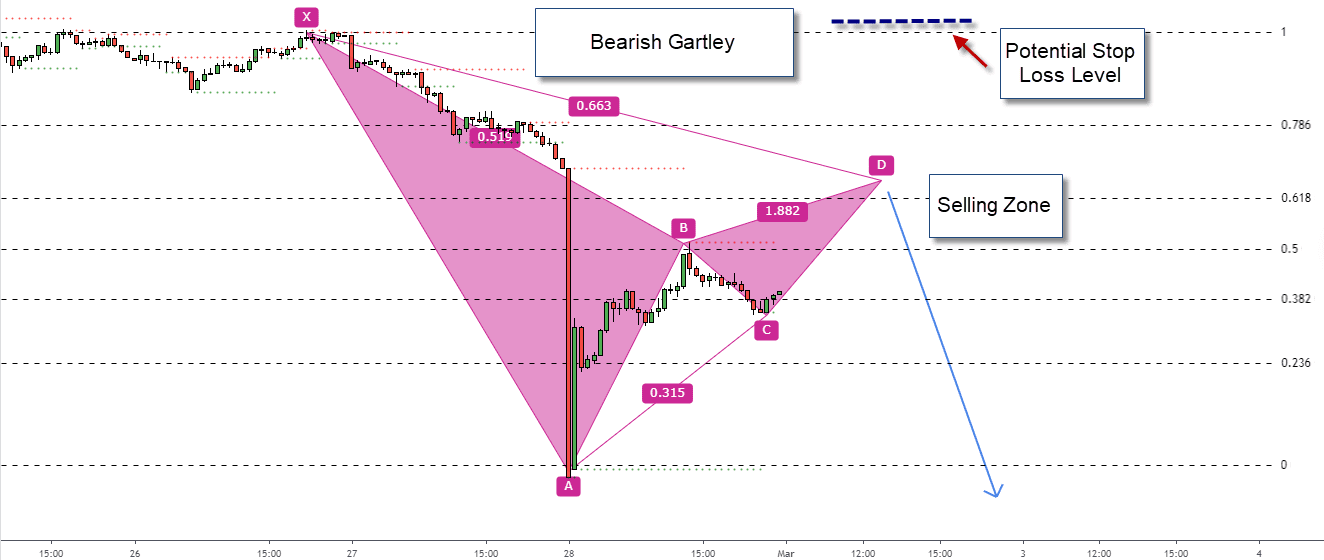
The Bearish Gartley Pattern
The Bearish Gartley pattern is like the Bullish Garley pattern in that is has the same five points. The difference is the impulse wave XA, declines and then is retracted to start the pattern. Your risk management could be created around a stop loss level that is just above the beginning of the impulse wave which is point X. You take profit level would be a multiple of this distance below point A.
Risk Management
Remember, like any setup for a trade, the Gartley pattern provides you with a range where you might consider purchasing or selling an asset. You want to make sure that when you trade using the Gartley Bullish and Bearish Patterns, the price levels fit your trading style.
This does not mean that you must use the Gartley set up in a vacuum. You can consider using other technical indicators in conjunction with Gartley patterns. Overbought and oversold indicators such as the relative strength index and stochastics might be patterns that help you determine if the setup creates an entry point that fits your trading style. Additionally, before you pull the trigger on a trade, make sure you test this strategy either by paper trading or using a demonstration account to make sure that your trading strategy fits your risk management style.
Key Take Away
The Bullish and Bearish Gartley patterns are 5-point patterns, that follow similar setups. Each of a basic ABC pattern that is preceded by an impulse wave XA, that is either rising in the case of the Bullish Gartley Pattern or declining in the case of the Bearish Gartley Pattern. The ABC setup of the Gartley Bullish Pattern and the Gartley Bearish pattern is generated using Fibonacci retracement and extension levels that target specific points.
After the setup is created, a potential reversal zone (PRZ), point D is generated as a target range that can be a buying point and a selling point. The exact point that you should purchase or sell short an asset should depend on your risk management. You want to have a consistent risk management plan where you stop loss level is below the beginning of the impulse wave and your take profit is a multiple of the percentage loss you might take.
PEOPLE WHO READ THIS ALSO VIEWED:
