What indicator can be used to signal the end of and start of market trends? Well the Triple Exponential Moving Average (EMA) can!
YOUR CAPITAL IS AT RISK

When used correctly, this trend following device can be a vital trader tool to provide a foundation for you to build day trade and swing trading strategies. It helps with trend direction, entry signals, plus with in trade risk management, assisting with stop placement.
Table of contents
What is the Triple EMA?
The Triple EMA is a technical analysis methodology that looks to identify price trends, eliminating the market “noise”. This allows you to ignore smaller, less relevant price fluctuations, concentrating on the primary trend in your time frame.
The Triple EMA uses three exponential moving averages, each one in turn calculated from the prior exponential moving average calculation, providing signals for trend direction, the end of trends and the start of new trends. We will look at the calculation in more details below.
The Triple EMA is to an extent a backward-looking indicator, in that it is based on historic prices. The use of the multiple calculations for the moving averages reduces the lag effect, so it does have solid forecasting potential.
As with any trend following method, the Triple EMA is less useful in a range trading, sideways environments. Therefore, a trend/ non-trend filter may be a requirement to using the Triple EMA.
What the Triple EMA System is not?
Please note, the Triple EMA differs from the similar named Three EMA System, or Three EMA Crossover System. This looks at three separate exponential moving averages and derives trading signals from the crossovers of the three exponential moving averages.
YOUR CAPITAL IS AT RISK
Example 1: Triple EMA Strategy (entry)
The Triple EMA System is a trend following system, that can be used to make intraday, short- and intermediate-term trading decision, to enter long or short trades, dependent on bullish and bearish signals.
In this first example in the chart below (Figure 1), we're going to use a S&P 500 short trade entry as our example.
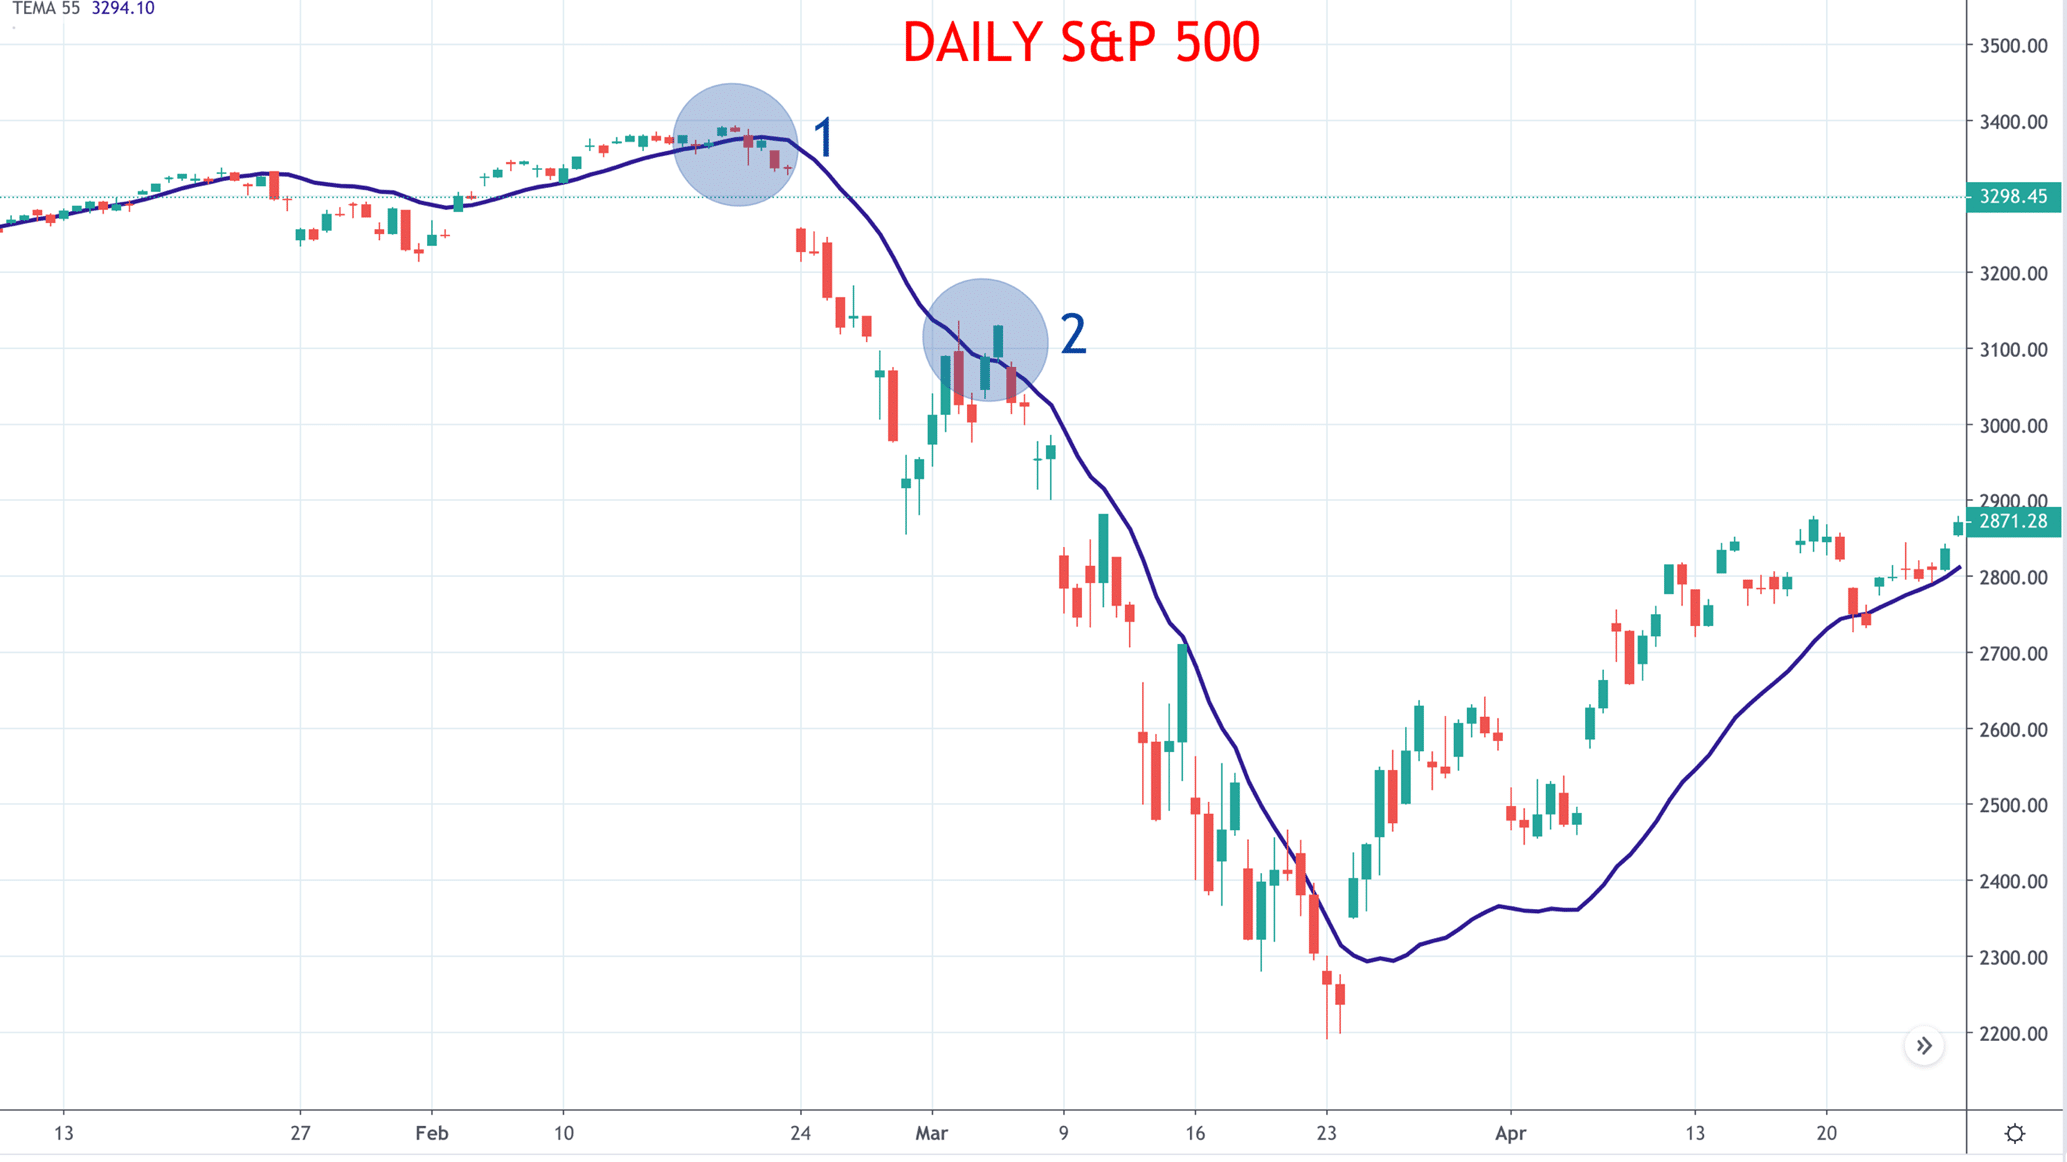
Figure 1: Daily S&P 500
In late February 2020 the price of the S&P 500 pushed below the 55-day Triple EMA, signalling an intermediate-term shift to bearish. A couple of days later, the direction of the Triple EMA turned negative too, with both these signals coming in the highlighted circle at (1). A bearish, short trade could have been entered on either of these signals, depending on the confidence of the individual treaders and the system being used. The stop loss placement would simply be just above the February record high.
In the highlighted in the circle at (2), the trader may have exited the short position, as the price crossed (and closed back above) the 55-day Triple EMA. However, given the 55-day Triple EMA did NOT turn upwards to positive at this point, a more aggressive system would see the short position maintained.
Moreover, a more confident trader who had yet to enter a short position but was bearish, maybe have used the opportunity highlighted in the circle at (2) to enter short.
Example 2: Triple EMA Strategy (exit)
In this next example, we are again looking at the S&P 500 and are going to use the Triple EMA Strategy to manage risk, by using it to exit a trade, as a trailing stop loss.
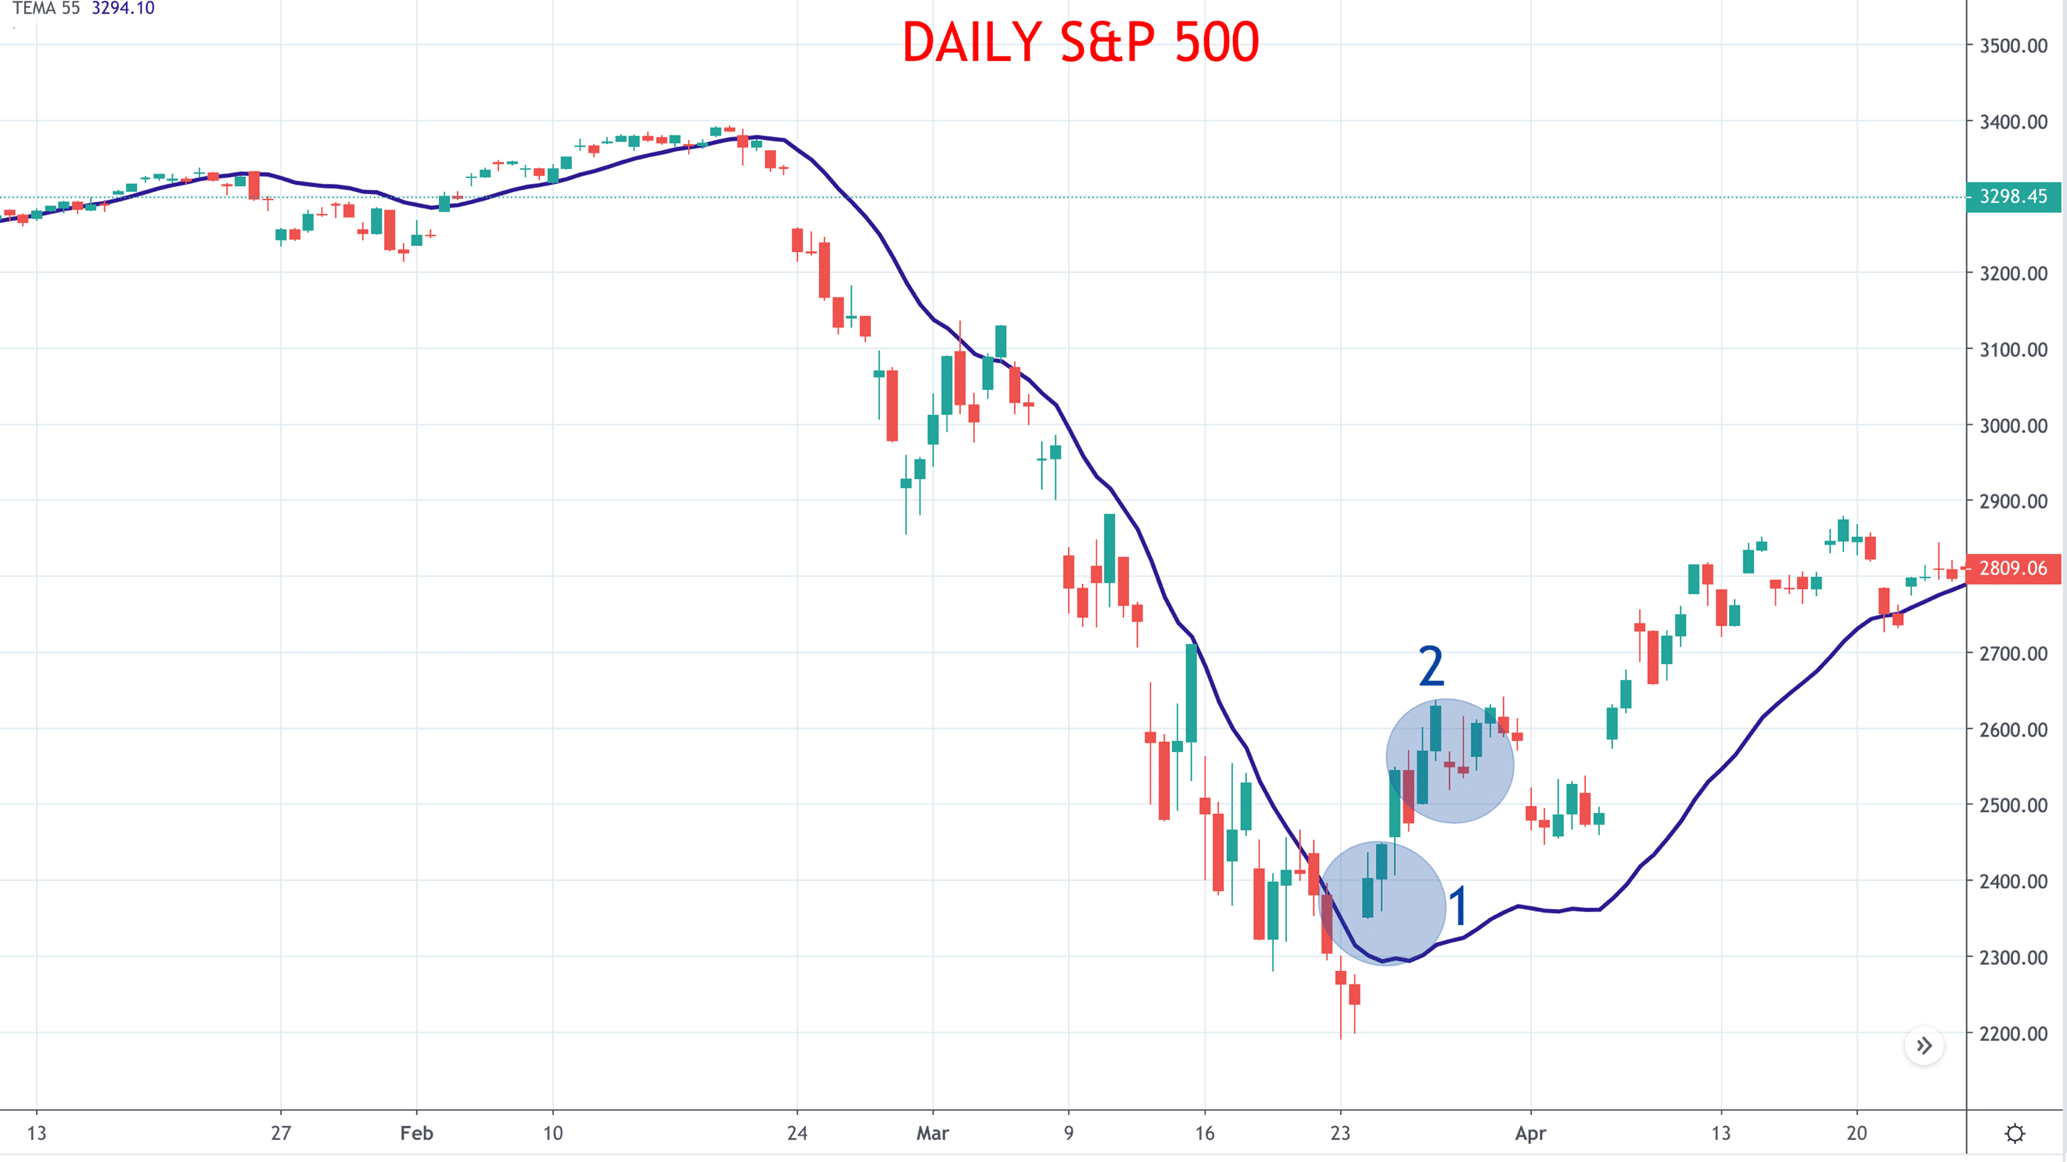
Figure 2: Daily S&P 500
If already short, as in Example 1 above, a trader may use the Triple EMA Strategy to use the 55-day Triple EMA as a trailing stop. In Figure 2, if using the 55-day Triple EMA as a stop, in the highlighted circle at (1) a more cautious trader may have exited short exposure quickly as price gapped up above the 55-day Triple EMA. A more confident trader may have waited for the 55-day Triple EMA to also then turn higher, which would have seen in this case a worse exit point, highlighted circle at (2).
YOUR CAPITAL IS AT RISK
Triple EMA Calculations
Here is the calculation for the Triple EMA (Exponential Moving Average)
Triple EMA = (3 x EMA1) – (3 x EMA2) + EMA3
Where:
EMA1 = Exponential Moving Average (with lookback n periods)
EMA2 = EMA (with lookback n periods) of EMA1
EMA3 = EMA (with lookback n periods) of EMA2
- So, the calculation is first to calculate the EMA from price with lookback period n, where n may be 9 for short-term trades, or n may be 55 for intermediate term trades. This gives you EMA1.
- Then calculate the EMA of EMA1, using the same lookback period n, which gives you EMA2.
- Similarly, calculate the EMA of EMA2, using the same lookback period n, which gives you EMA3.
- Finally, put these values into the Triple EMA to calculate the Triple EMA.
Triple EMA Strategies

As highlighted in the examples above, the Triple EMA is a trend following system, which can be used in a number of ways.
- Trend direction – the direction the Triple EMA is pointing highlights the trend direction on your time frame.
- The Triple EMA provides support and resistance levels in itself. So, as in the examples above, a price break above or below the Triple EMA can be used to bother enter and edit trades.
YOUR CAPITAL IS AT RISK
The Bottom Line
- The Triple EMA System enables you to be able to identify market trends
- It can be used to give entry and exit signals.
- It differs from the Three EMA Crossover System
- The Triple EMA System reduces (but does not eliminate) the lag effect associated with standard Simple or Exponential Moving Averages
- As with all trend following systems, the Triple EMA System does not work well in a non-trend, range trading consolidation phase. A filter may be required to identify trend versus non-trending markets.