The price of gold heavily influences Newmont Corporation stock (NYSE: NEM), both from a current price level, and short of long-term forecast predictions. This US-based miner has for 100 years offered the chance for investors to buy its stock and, by proxy, benefit if the price of gold rises.
It has operations across the globe, a well-established pipeline of gold reserves, and is listed on the New York Stock Exchange. It’s a mature, stable, well-run firm, which means those asking, ‘Is Newmont Corporation a good stock to buy?’ need to lift the lid on what’s going on in the gold market to find an answer.
All mining stocks are a relatively high-risk proposition, but Newmont could offer a route into the sector with relatively lower price volatility. This Newmont Corporation stock forecast will use technical and fundamental analysis to outline the short and long-term prospects for the firm. Nothing is ever guaranteed in the markets, but if the mining and gold sectors are on your radar, Newmont, the world’s biggest gold producer, could be worthy of a place on the shortlist of candidates.
Where Will Newmont Corporation’s Stock Price Be in 12 Months?
Short-term price moves in commodity markets are driven by demand more than supply. Newmont and other gold miners require years to bring new reserves to the market. This inelasticity of supply is due to the time it takes to locate, evaluate, and finally get to market new supplies of precious metals. No matter how extreme a change in demand is, miners have little capacity to adjust their processes to exploit any price moves.
The catalyst for any breakout has not yet been confirmed. The US Federal Reserve is usually one likely candidate, as gold prices tend to be inversely correlated to interest rate levels. However, given interest rates have risen in recent years and gold has climbed to new all-time highs in 2024, this correlation has been less reliable recently. Even so, any move to cut rates by the Fed should still provide a boost to gold prices.
Furthermore, despite the gold rally, NEM’s stock price has been under significant pressure since April 2022. However, this is more company-specific. In February, Newmont said it was planning to sell assets and reduce its dividend as it refocuses its portfolio.
In addition, it provided a disappointing 2024 production guidance with an anticipated 6.93 million ounces of gold.
Even so, the decline in the Newmont share price may attract investors looking to get in at lows. In addition, the prospects for Federal Reserve rate cuts may boost gold, giving the Newmont share price at least a small lift.
At the time of writing, 14 analysts currently have a Buy rating on Newmont, with nine assigning the stock a Hold rating and two a Sell rating. The average price target among 21 analysts offering forecasts for the stock is $48.32, representing a potential 19% upside from current levels (as of June 7, 2024).
Newmont News
In its April report, Newmont said its attributable gold production fell 4% to 1,675 thousand ounces from the prior quarter, mostly due to lower production at Tanami based on a planned mill shutdown and seasonal rainfall impacts as well as the ongoing stripping campaigns at Boddington and Akyem. Newmont reported Q1 earnings of $0.55 per share, topping the consensus estimate.
In April, Newmont announced the appointment of Francois Hardy as its new CTO. Hardy leads Newmont’s technical work across the business to improve operational performance and drive growth.
In March, Bloomberg reported that Newmont has begun the sale of its Akyem gold mine in Ghana. The mine was said to be attracting interest from potential bidders, including Chinese producers. Furthermore, the publication, citing sources, said Newmont was working with Citigroup on the disposal and has started sounding out prospective suitors.
Who is Newmont Corporation (NYSE: NEM)?
Newmont Corporation Copper & Gold Inc. is a New York Stock Exchange-listed stock that operates under ticker NEM.
It’s one of the largest precious metals miners, with the firm and its 14,600 employees all focusing on extracting and processing gold. Other metals, such as silver, copper, lead, and zinc, form part of the firm’s revenue streams but are regarded more as by-products of the firm’s primary operations. As a result, any Newmont stock forecast ultimately comes back to the fact that, as the company’s website states, “Newmont’s reserve base is a key differentiator.” It has active gold mines in countries including Nevada, Australia, Ghana, and Peru.
The firm’s value is based on its ability to carry out its daily business of extracting and processing gold on a large scale. There are some hit-or-miss style exploration projects in the pipeline, but it has an extensive and diverse portfolio of assets. There are also few signs of any change in corporate strategy. As a proven and reliable gold miner, the NEM share price closely mirrors moves in the price of gold on commodity exchanges.
One way in which Newmont does stand out from the peer group is its approach to sustainability. Investor and public pressure are causing large corporations to move towards more socially and environmentally conscious production methods. The mining sector will never be a natural home for green investors, but NEM has gone some way to insulate itself from some of the potential fallout from the change in investor appetite.
Newmont has adopted forward-thinking policies relating to environmental, social, and governance practices in relation to its peer group. It sees itself as an “industry leader in value creation, supported by robust safety standards, superior execution, and technical proficiency.”
Institutional investors such as pension funds are giving a higher priority to such issues. Any large fund with an investment mandate to include mining stocks but an eye on eco and social concerns might find Newmont a good fit. If buying NEM stock with ‘real money’, then that can also be good news for existing retail shareholders. Newmont is also the only gold producer listed in the S&P 500 Index, which means tracker funds must take a position in the stock if they are trying to replicate the index’s performance
Newmont Shares Long-Term Forecast
Any Newmont Corporation stock forecast for 2025 and beyond will still be heavily reliant on the price of gold. A longer timeframe does allow the firm to make a case for it being a well-run operation deserving of the reputation it has built over one hundred years.
One of the management team’s main aims is maintaining a pipeline of new supplies, which take a long time to come to the market.
New mines replaced 80% of the firm’s depletion in 2020, and 88% of Newmont’s gold reserves are located in the politically stable countries of North America and Australia. Longer-term prospects of new mines are also in the pipeline, with the firm previously stating it has an “unmatched land position.”
Mining companies benefit from a neat calculating procedure when the price of gold rises, which means their profits can increase exponentially in relation to the price of gold itself, and a lot of the cost base is made up of fixed rather than variable costs. If, for example, the price of gold is $1,800 and NEM’s profit margin at that level is $600 in cash terms, then a 10% increase in the price of gold to $1,980 would result in profit margins increased by 30%, not 10%.
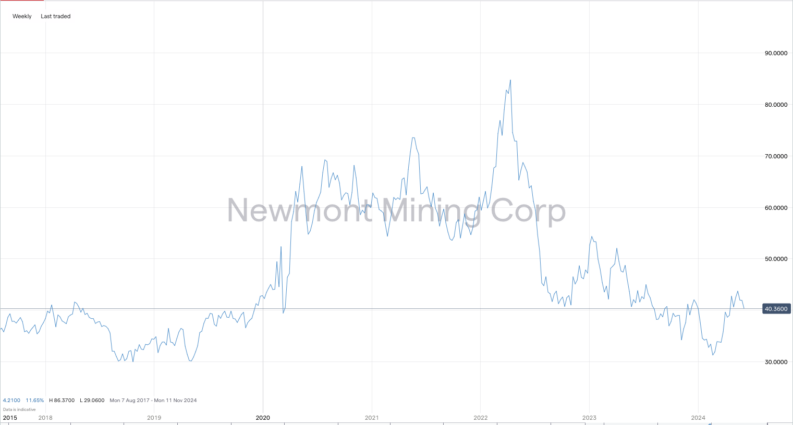
Potential downside risks to the Newmont share price need to be considered. Some have noted slight concerns about its debt, while the stock will be judged on its gold production and earnings performance, which recently disappointed investors and is something to watch out for over the long term.
Is Newmont Stock a Buy?
The mining sector is a tough one to call as there are a lot of variables in play. Mining firms can do little about global interest rates or the appetite of investors for precious metals. The things they can do something about, namely adjustments to production levels, take years to change.
Given the rollercoaster-ride nature of mining investments, Newmont might be of particular interest to those starting in the sector. It’s a big, established firm that has been operating for more than 100 years. The operations have been set up to ensure long-term extraction of gold is carried out from geographically diverse locations. The firm is unlikely to pull any rabbits out of hats, but nor is it likely to go bust if one of its prospective claims turns out to be a dud.
There may be more ‘exciting’ firms out there, but Newmont may well be one of the best options for those looking for a ‘boring’ miner at a cheap price. Basic principles of risk management would still need to be applied, especially given the recent downturn. The more speculative an investment, the smaller the amount of capital that should be allocated to it. This rule particularly applies to mining companies where stock prices are subject to dramatic price swings in the global commodity markets. The Newmont share price is closely correlated to one asset, gold, so the risks (and returns) are intensified.