
The Flag Pattern Explained
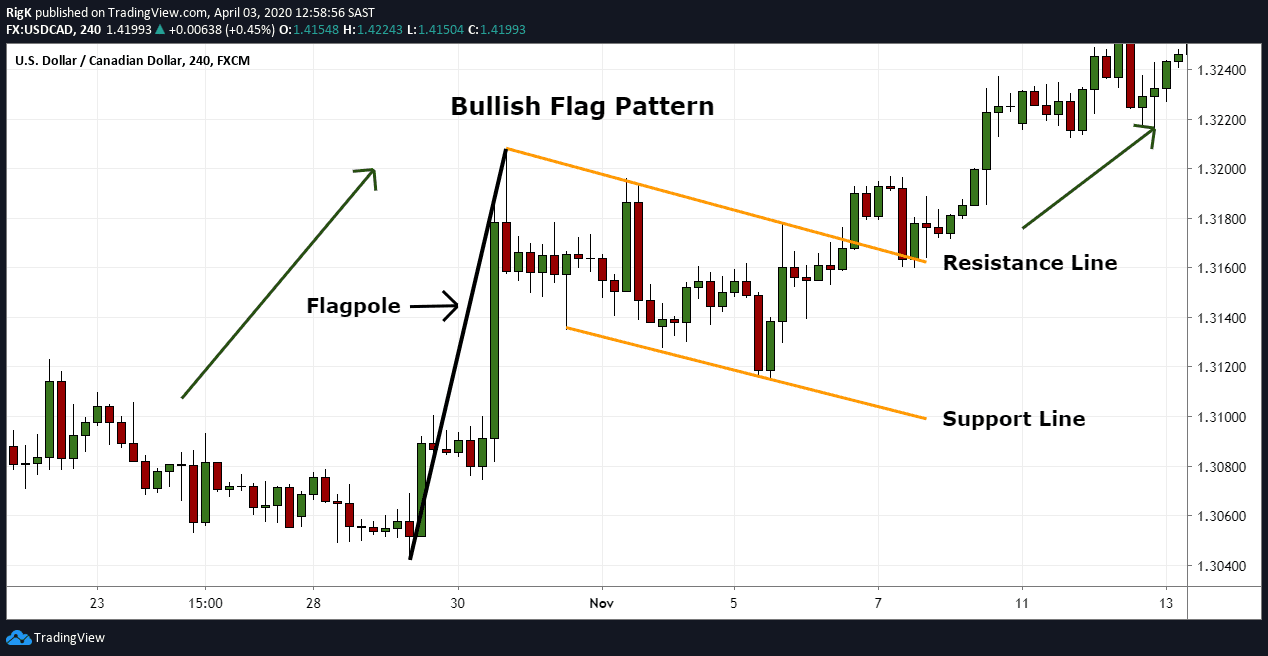
The flag pattern is a continuation formation that can appear during a brief pause in either a bullish or bearish trend. The chart example above shows a bullish flag pattern that formed in the USD/CAD currency pair.
These patterns consist of two parallel lines that act as support and resistance during a consolidation phase which resembles the flag with the preceding upward move resembling the flagpole part.
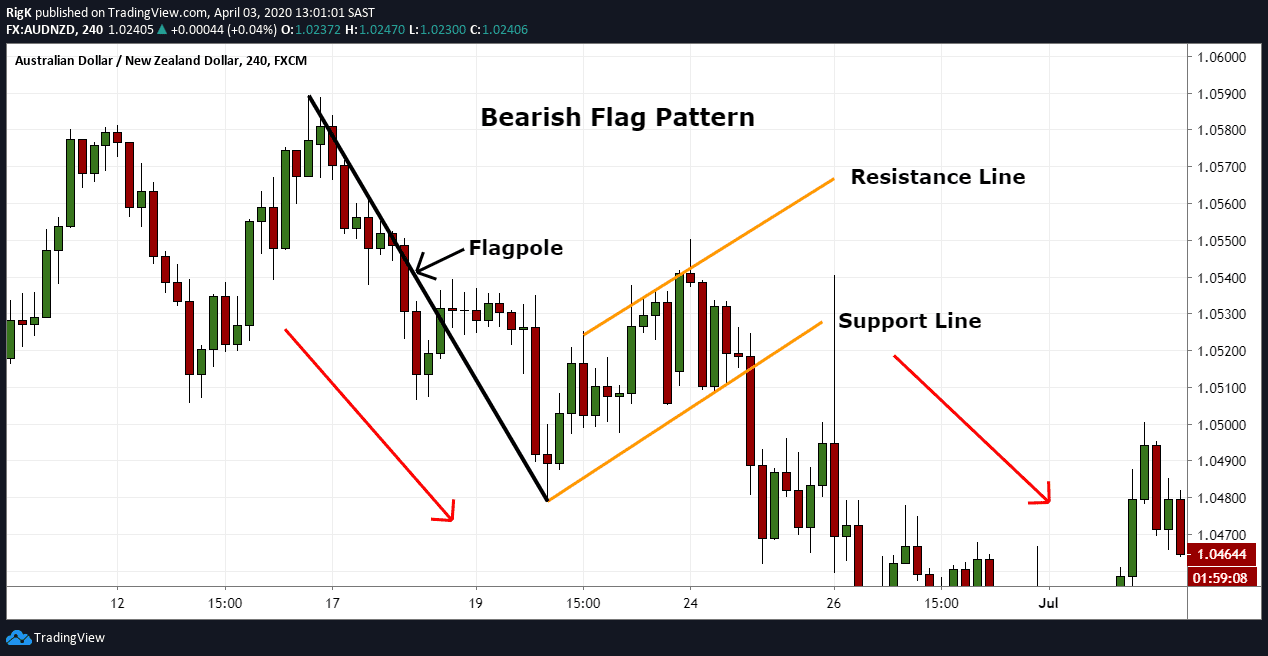
The second chart example shows the bearish version of a flag pattern in the AUD/NZD and is simply the inverse of a bullish flag.
How to Trade the Flag Pattern
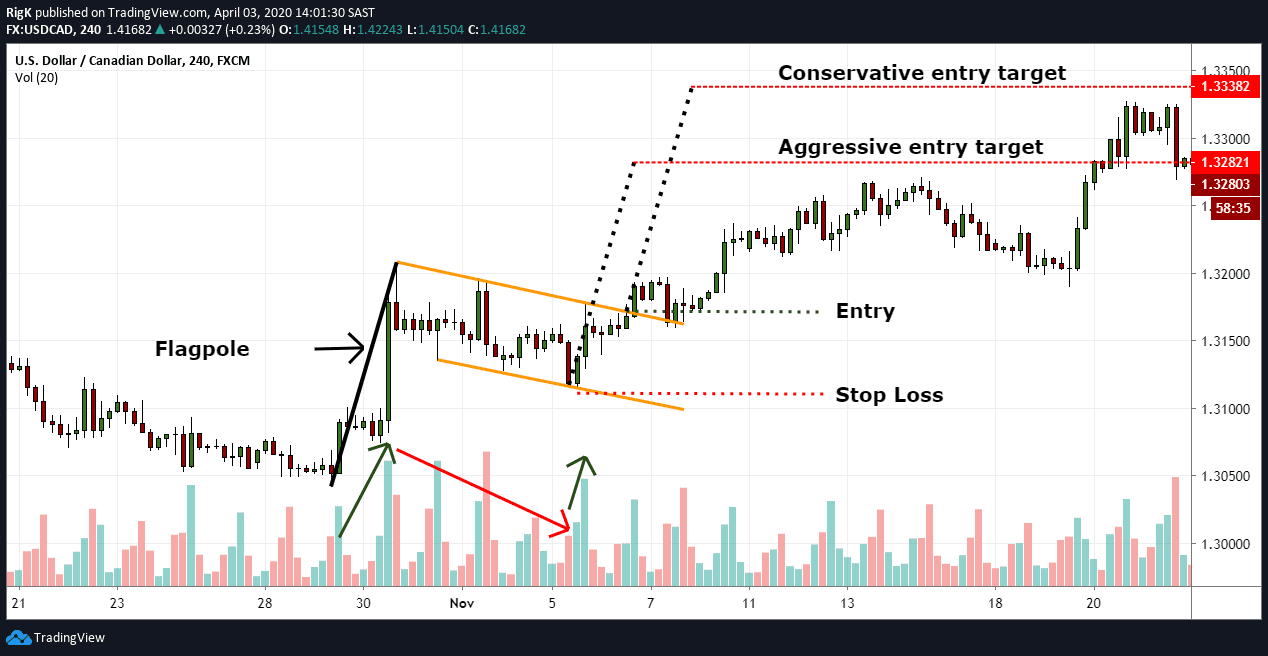
Using our previous bullish flag pattern, aggressive traders will often execute a long position at the lower support line and place their target above their entry, equal to the height of the flagpole.
Conservative traders, on the other hand, will tend to wait for a breakout of the upper resistance line first before they will enter and also target a level equal to the height of the flagpole.
Traders Tip: It will generally display certain characteristics during its formation which can help a trader qualify whether this pattern will present a good trading opportunity or not.
- Firstly, it will be a good idea to watch how volume reacts leading into the flag part and how volume behaves during the flag formation. When you see an increase in volume during the flagpole part and a decrease in volume during the flag phase, then that is a good sign.
- Secondly, you typically do not want to see the flag formation retrace more than 50% of the flagpole, otherwise, you might not be dealing with a flag pattern at all.
- Lastly, an increase in volume prior to the breakout is often a good indication that the pattern completed.
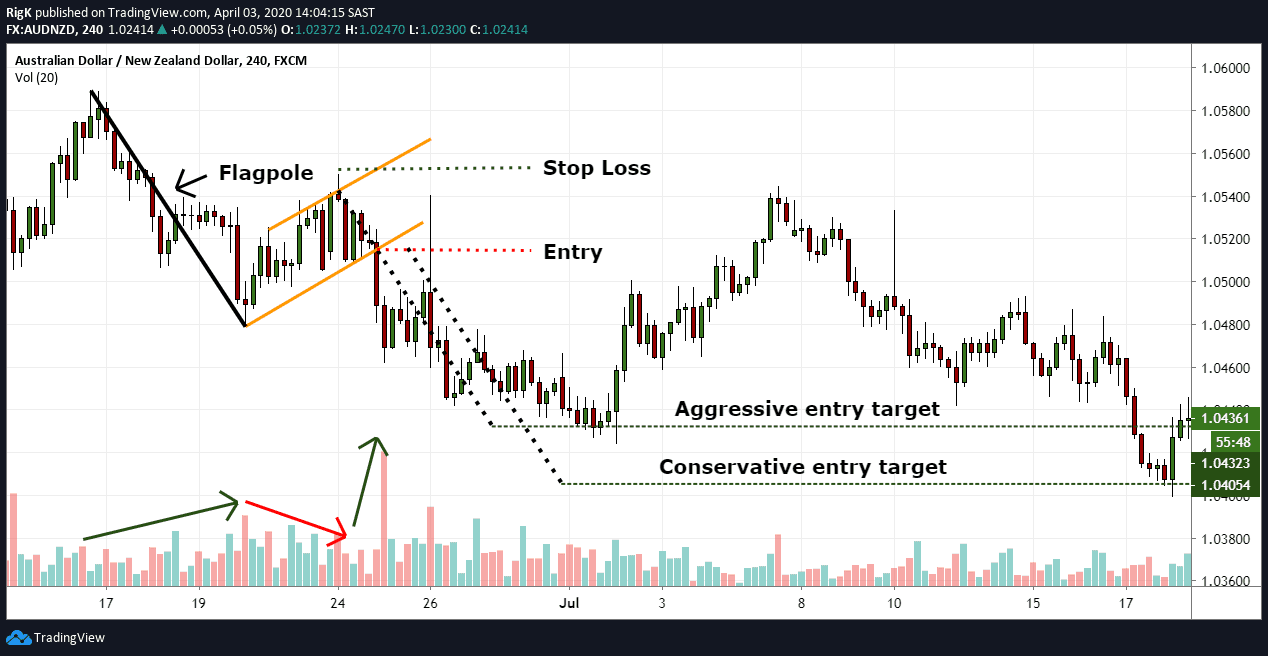
My final chart shows the same bearish AUD/NZD flag pattern that was presented before and displays the same characteristics from a volume and retracement perspective. In this example, both the aggressive and conservative entry methods would have reached their targets.
Note: Bearish flag patterns will not always show a decline in volume during the flag formation since bearish markets generally move faster due to the underlying fear and anxiety that drive a sell-off. This behaviour can in some instances lead to a less pronounced increase in volume during the breakout phase.
The flag pattern is a powerful trend continuation chart pattern that appears in all markets and timeframes. Once these patterns come to an end, the resulting move can often be strong and reach your target quickly, which is why it is so popular amongst technical traders.
PEOPLE WHO READ THIS ALSO VIEWED: