
The triple bottom is a bullish reversal chart pattern that could be an indication that sellers (bears) are losing control of a downtrend and that buyers (bulls) are taking over.
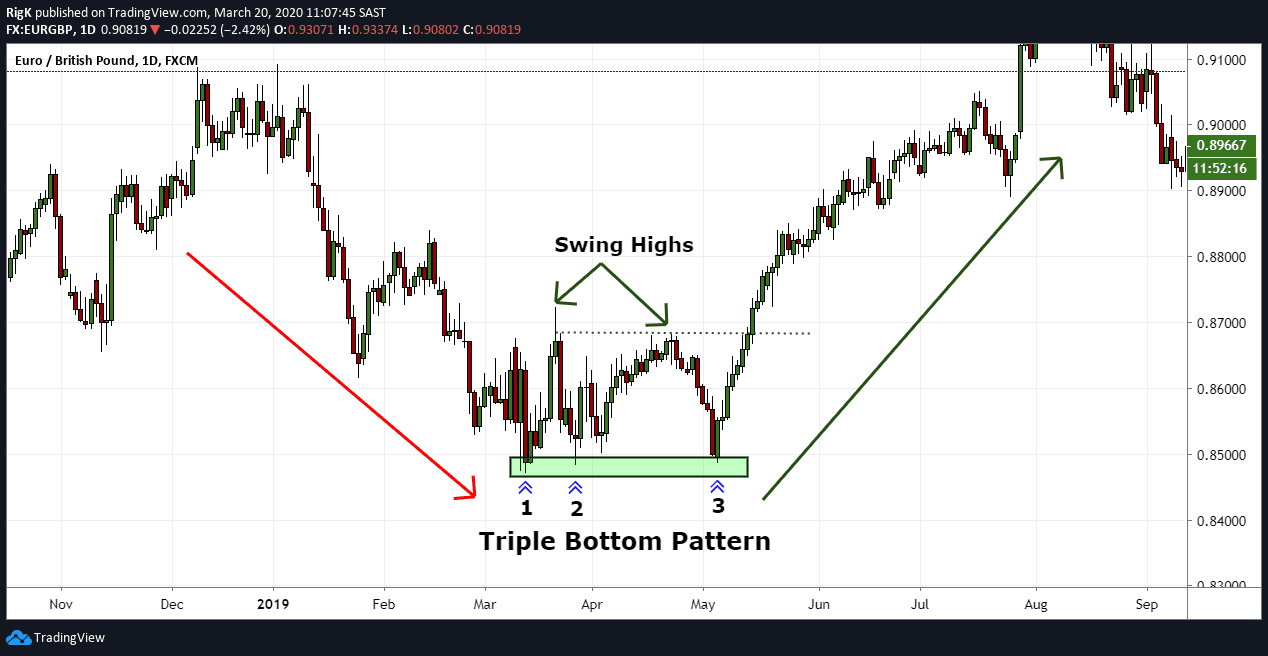
The chart example above shows a triple bottom formation that turned the EUR/GBP forex pair to the upside after a downtrend. After the first low, price corrected higher and formed a swing high, followed by another decline that ended at roughly the same level as the first bottom.
Price then created a second swing low, which was almost similar in height to the first swing high and again reversed lower, failing to break below the previous two bottoms.
Traders will often wait for price to break above the final swing high first to confirm that a triple bottom has completed and very often the resulting move higher will be the start of a new uptrend.
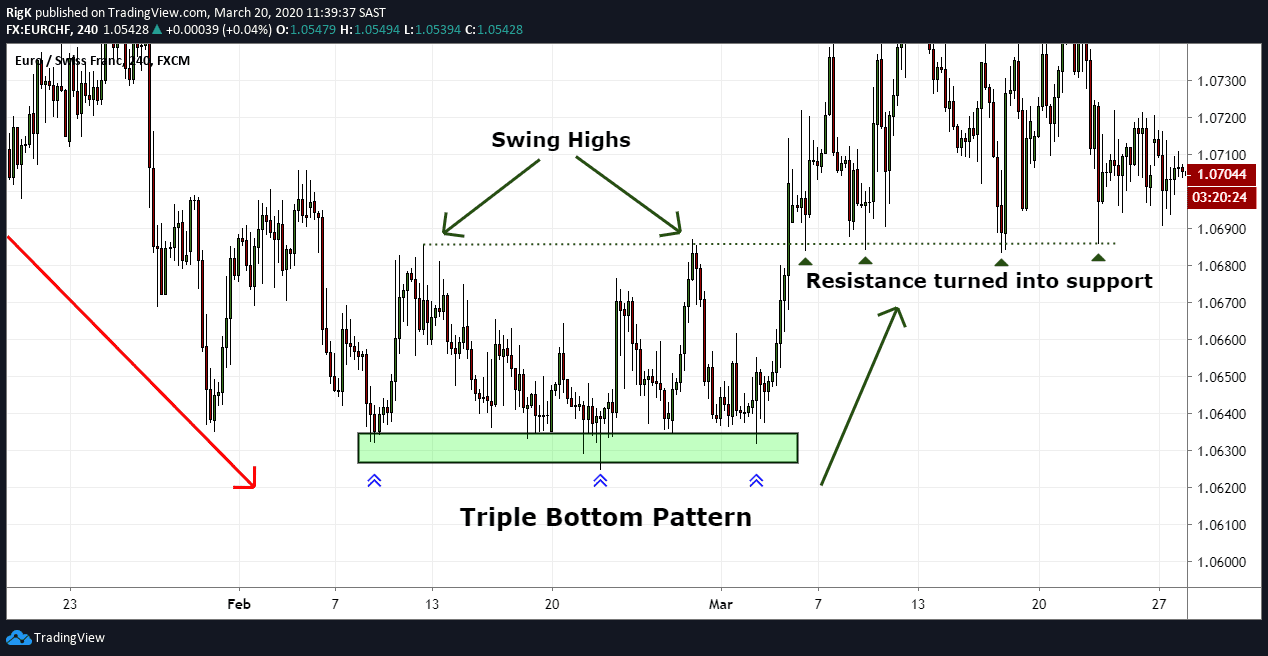
My second chart example was taken from a 4-hour timeframe of the EUR/CHF forex pair and shows a triple bottom that was a bit more complex than the first example. Note how price tested that price zone on multiple occasions and failed to close below the first bottom. Those wicks that were left behind can be seen as the sellers losing control of this market and the more they tried to sell, the more they were challenged by the bulls until they lost the fight and price turned higher.
Also note that the two swing highs were roughly at the same height, which is not always a requirement but a great sign that a triple bottom might be in its final stages, especially when price came down a 3rd time and failed to break below that zone.
Triple tops should however not be confused with the inverse head and shoulders pattern which can visually look similar to triple bottoms. Inverse head and shoulders patterns will instead have the middle bottom extend below the other two peaks, but they are traded in a similar way to triple bottoms when price breaks above the previous swing highs.
Traders Tip: An early indication that a triple bottom might be over, will be to watch volume as price trades higher towards the swing high level. An increase in volume before price breaks above the swing highs will often be a good sign that your triple bottom has completed.
The triple bottom pattern is a powerful reversal pattern and with additional confirmation from your volume indicator, this pattern will not only signal a potential change in trend but keep you on the right side of price action.
PEOPLE WHO READ THIS ALSO VIEWED: