
The price action trading strategy is also referred to as naked trading because it involves traders making their trading decisions based on the price bars that they see on the chart without the help of indicators or other types of analysis.
Image 1: A naked price chart
Price action trading is the preferred trading method for most professional traders because it allows them to make quick decisions regarding where they think the price is heading without having to wait for the signals generated by trading indicators most of which lag the price movements of the instrument they are trading.
The main pillars of price action trading
The key pillars of price action include identifying the type of trend that exists in a particular price chart and then narrowing down on the price setups that you want to trade. For beginner traders, the best price action setups to trade are resistance and support levels, while the best price action structures to trade are breakouts. However, you have first to identify whether the price is trending or it is consolidating. If the price is trending, you have to determine whether the trend is smooth or uneven.
Image 2: A smooth trend
The middle section in the above image represents a smooth trend that was followed by a pullback.
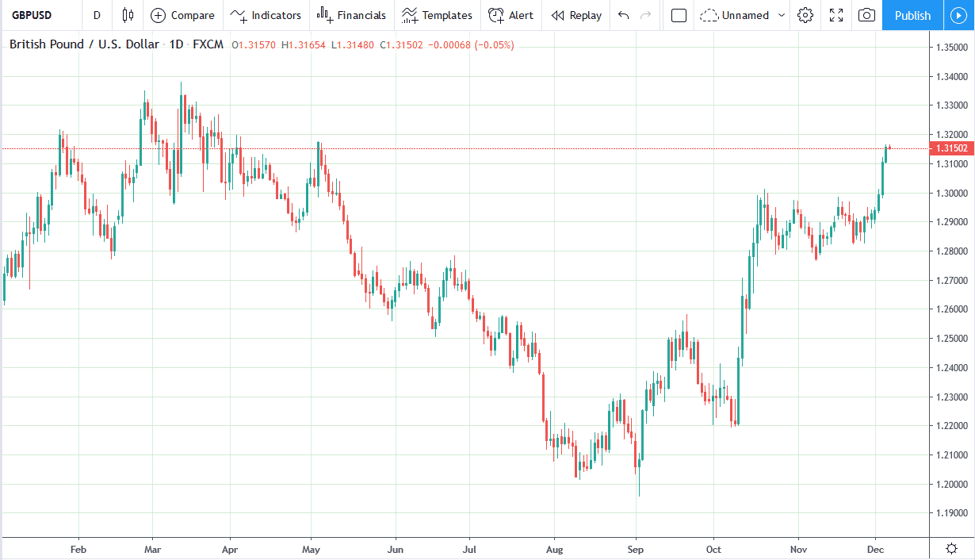
Image 3: An uneven trend on the GBP/CAD 4-hr chart
The above chart shows an uneven trend, which is also known as a volatile uneven trend. Beginner traders should generally avoid uneven volatile trends as they are extremely hard to trade and should focus on identifying and trading smooth trends. Smooth trends are easier to trade because they have well-defined support and resistance levels, which beginner traders can use to hone their skills while making some profits.
Always trade with the trend
Most traders associate trend trading with indicators such as the moving average among many others, but this is just one way of trading along with the trend. You can also trade with the trend using price action strategies; in fact, most price action trading strategies are built on trading with the trend. For example, a key component of price action trading is to take trades at support and resistance levels, which is a strategy that revolves around trends.
Trading based on support and resistance levels
Most price action traders look to take trades around support and resistance levels because these zones carry minimal risk and high reward potential. You can trade support and resistance levels in two major ways, which are to look for trades when price breaks below or above such levels or to get into trades when such levels are respected.
Live price action trading example
This section shall cover a live trade setup on a currency pair where you could have had the chance to apply what you have learned about price action trading on this pair earlier this year.
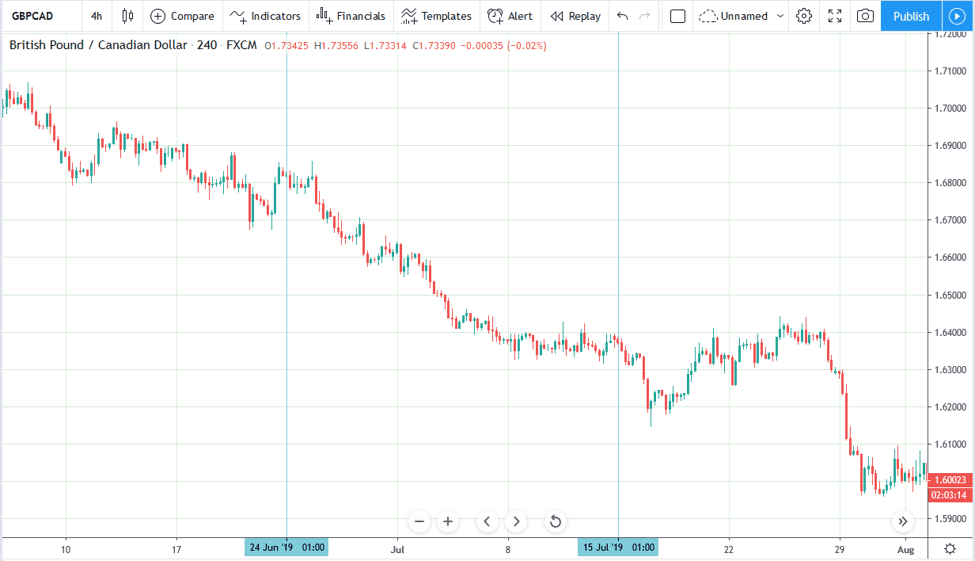
Image 4: Live price action trade setup on the GBP/CAD daily chart
The chart above has only three structures on it with a black horizontal line at the top, a rectangle below it, an arrow and a blue horizontal line in the middle. However, a lot is going on in the above chart from a price action perspective as explained below.
Firstly, the black horizontal line at the top highlights a key resistance level that has held since 30th April 2018, that is, for over a year when the price crossed below this crucial support level, now turned into a resistance level. As a price action trader, the fact that the resistance level has been in place for over a year indicates that it is unlikely to be broken by buyers at the first attempt.
The same scenario happened leading to the price trading in a wide range represented by the rectangle, which covers a period of three months lasting from February to May. You can see how we have transitioned from the horizontal resistance line to the rectangle formation that represents a consolidation range.
Experienced price action traders would be watching the rectangle for clues as to whether the price would break to the upside or the downside, which could indicate that a new trend was about to begin. However, as nobody knows when the range-bound price action is going to end, savvy traders would be looking to buy the currency pair at the bottom of the rectangle and would take short trades near the top of the rectangle.
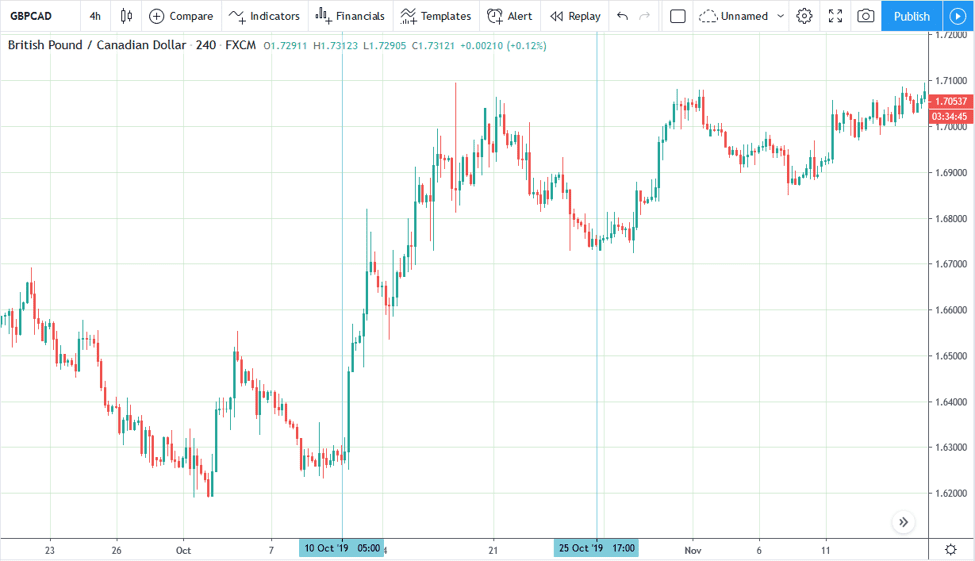
Image 5: A zoomed-out GBP/CAD daily chart
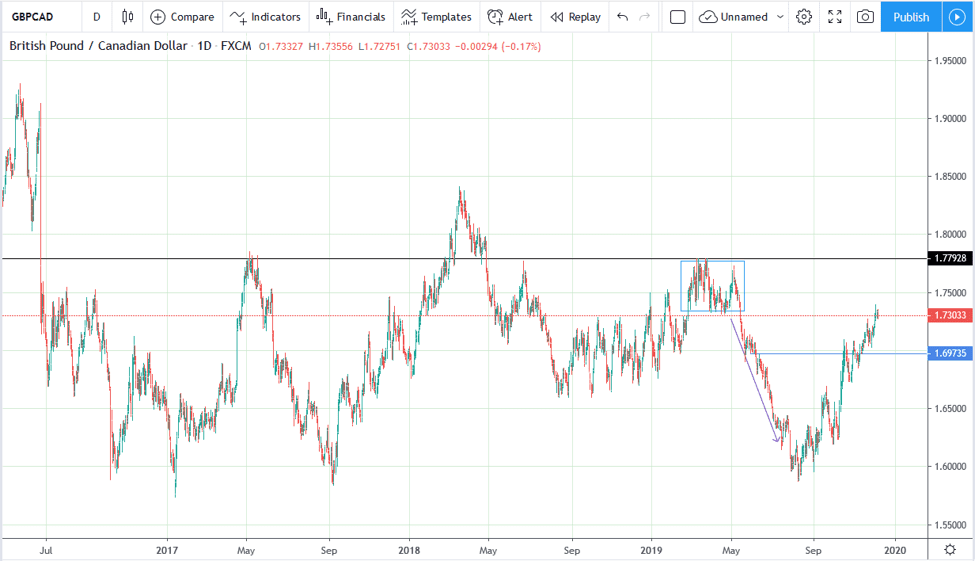
The chart above shows that the horizontal resistance level was in place for over three years and had been broken only once during that entire period, which communicates that this is a very strong resistance zone. Therefore, the scales are tilted heavily towards the bearish side and the chances of a break to the upside are quite minimal. Price action traders consider all this and will be looking to short the pair at the highs of the rectangle more than buying at the lows as the higher timeframe indicate that the price momentum is likely to remain bearish. You can also see that the last high in the rectangle formation did not reach the top of the rectangle, which implies that the bears stepped in overpowered the bulls and pushed the currency pair’s price lower.
Adding to your winning trades
Another major advantage of trading using price action strategies is that you can easily pinpoint strategic locations where you can add to your winning trades. The most successful traders capitalise on their good trades by adding to their winning positions if the trend is on their side.
Image 6: Adding to winning positions on the XAU/EUR daily chart
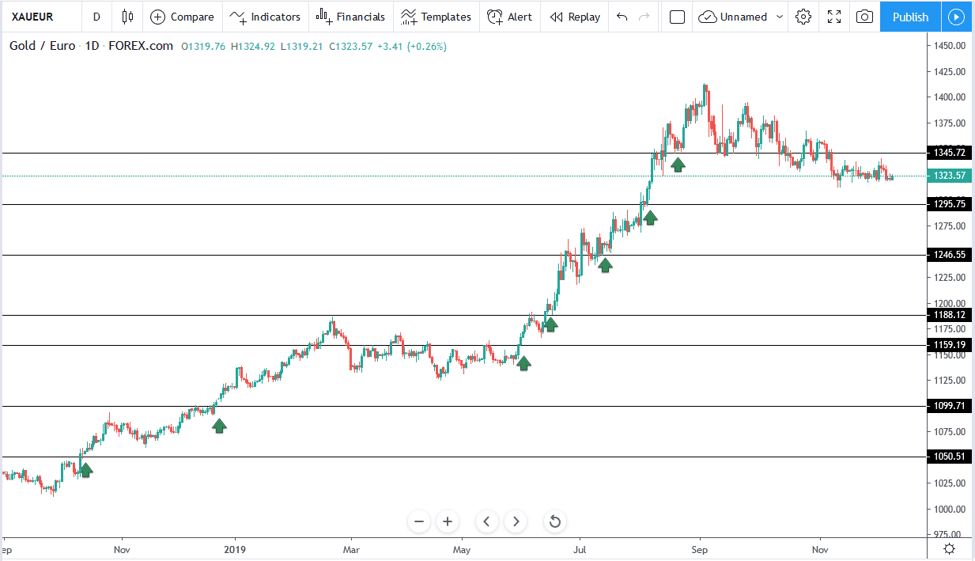
The gold/euro daily price chart above is a perfect example of how a price action trader can benefit from a trending market by adding to their winning trades. The above chart is a perfect example of a long-term bullish trend that for close to a year, which gave long-term price action traders a rare opportunity to ride a very bullish trend.
You can see that there are minimal pullbacks in the gold/euro chart and that traders had multiple opportunities to add to their existing trades whenever the yellow metal traded sideways against the euro. Gold inched higher slowly against the single currency during the first few months represented by the first half of the chart before trading sideways for several months and then rallying higher for another few months.
Traders who took this trade in October 2018 and held on until the bullish trend peaked in September 2019 could have pocketed a $3500 gain profit per lot traded. Traders who added to their initial winning trade could have pocketed larger profit as would traders with larger account sizes who chose to trade in larger lot sizes. This trade is proof that you can be a trend trader using price action principles and you do not have to follow any indicators to capitalise on long-term trends.
Why price action strategies work
Most beginner traders may wonder why price action strategies still work despite the different strategies being known and used by many professional traders. The reality is that most professional traders transact the same currency pairs traded by retail traders and make their decisions based on the price changes that they see. You cannot say the same about traders who use indicators given that a small percentage of traders may use some indicators such as the MACD indicator and the RSI. However, popular indicators such as the simple moving averages are used by many traders, which is why they are also very effective.
Price action trading strategies work very well because they are used by most professional traders who prefer to trade directly based on the price changes instead of using indicators. These strategies work because of their popularity and the fact that human behaviours are very predictable. The currency and stock markets go through the same bullish and bearish cycles some of which last for years because human nature is very predictable, which is also a big reason why price action and technical trading strategies work so well.
Trading breakouts
The key to trading breakouts using price action strategies is to monitor the behaviour of the price candlesticks leading up to the breakout. You should be careful to avoid confusing a reversal setup with a pre-breakout structure. A breakout is likely to occur if the price action leading up to the resistance or support level indicated that buyers or seller were slowly getting control of the price. You should also be careful when expecting the price to break out of a resistance or support level that has held for months or years at the first try as this is unlikely to happen.
To trade a breakout successfully, you have to look for a price buildup around a key support and resistance level, as shown in the image below.
Image 7: Pre-breakout and breakout structure on EUR/JPY hourly chart
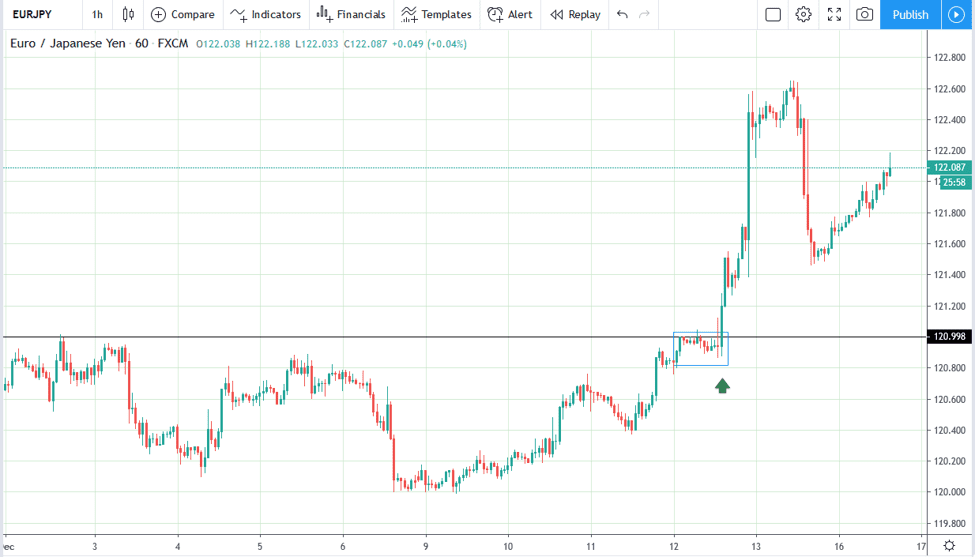
The above image shows a pre-breakout structure on the EUR/JPY hourly chart that led to a massive breakout trade for price action traders who were monitoring the pair. You can see that the resistance level highlighted by the black horizontal line and that the price squeeze or pre-breakout structure signalled a potential breakout that happened.
Image 8: breakout structure on EUR/JPY daily chart
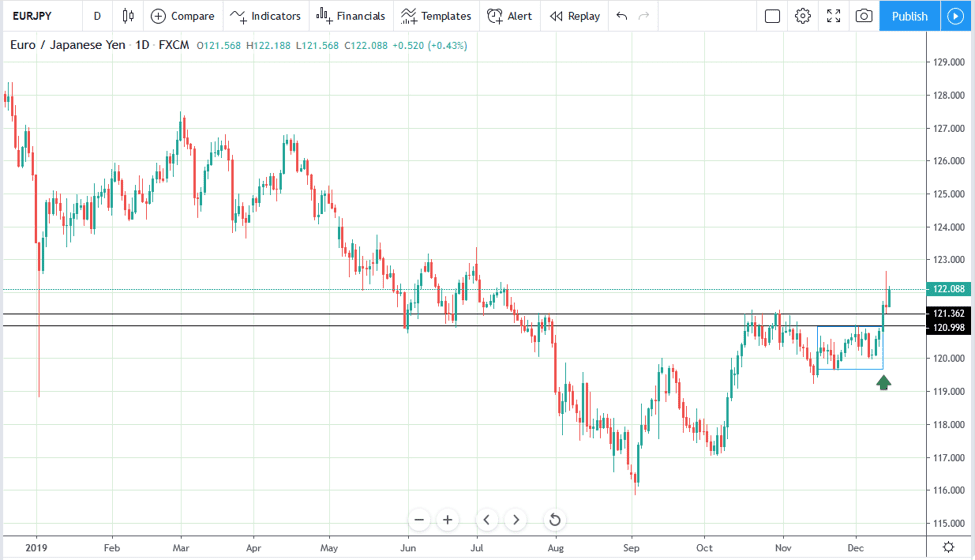
The price was stuck below the key resistance level for over four months and previous attempts to break above the level had failed. You can see on the daily timeframe chart that a larger pre-breakout structure had formed over the last three weeks as orders piled up near the resistance level before the final breakout. Given that the resistance level had been in place for several months, it is highly likely that the price will retest the resistance level, which has turned into a support zone before rallying higher.
The above breakout could turn into a false break if the price reverses and closes below the resistance zone, in which case our bullish trade idea would be invalidated, and we may book a loss. You should always manage your risk as you trade the markets because there are no guarantees that any trade setup will work out in your favour. Trading is a game of probabilities and you should always keep this in mind regardless of how promising a trade setup appears.
Trading reversals
You can use price action strategies to trade trend reversals and capture the large moves that usually follow once a new trend begins. There are several ways in which you can trade reversals, which all involve looking for specific candle formations at key turning points. Price action traders can look to trade reversals at key support and resistance levels, at Fibonacci retracement levels and strategic pivot points.
Trading reversals at support and resistance levels
Beginner traders should look to trade trend reversals at key support and resistance levels since we have already covered how to trade at such levels earlier in the article.
Image 9: Trading reversals on the EUR/USD 4-hr chart
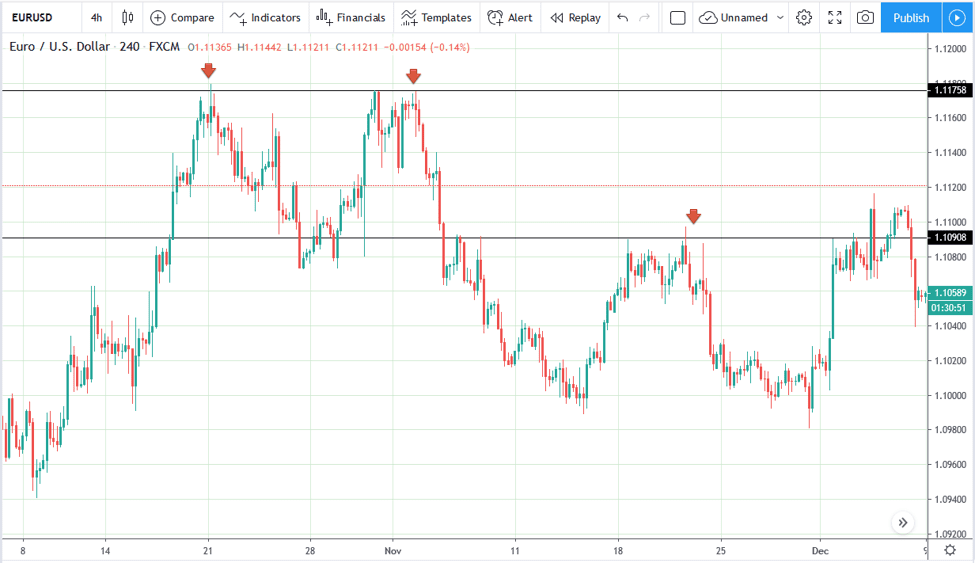
The above chart shows three points at which traders could have gotten into reversal trades on the EUR/USD 4-hr timeframe chart. The three trades qualify as reversal trades because they are short trade opportunities that appeared at the top of a bullish trend. One of the easiest ways to identify a reversal trade is to look for rejection wicks, which usually occur when traders are fighting to control an instrument’s price. For example, the rejection wicks that formed in the above charts show that sellers stepped in at the resistance levels and prevented the bulls from pushing the price above the level.
Image 10: Rejection wicks on EUR/USD daily chart
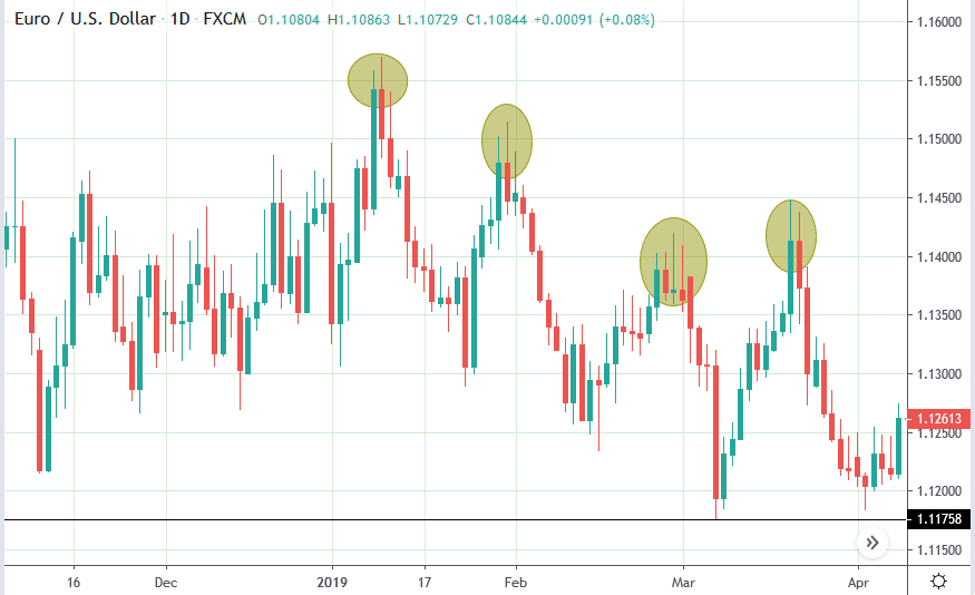
The best rejection wicks are those that are at least half the length of the entire candle, which usually indicates that either the sellers or buyers have more control over the asset’s price. The longer the rejection wicks, the higher the chances that a reversal will occur.
Identifying key levels is a big part of trading reversals because most institutions watch these areas and they park a lot of pending orders at such levels. The fact that most professional traders park their orders at key levels is the main reason why identifying such levels in advance can be a major advantage for retail traders. However, you should be careful not to be trapped on the wrong side of this trade by having a stop-loss order as in some cases the reversal might not occur. Always remember that trading is a game of probabilities and you should always limit your risk exposure as there are no guarantees that the price will go your way.
You can also trade reversals using other technical analysis tools such as pivot points and Fibonacci retracement levels, but we’ll cover these tools in other articles.
Advantages of price action trading
A major advantage of trading using price action strategies is that the analysis process is much simpler, given that all you are doing is looking at an asset’s price action. You do not have to interpret the different meanings associated with indicators, which are all derived from the price action. Price action strategies allow you to focus on understanding the direction of the price while avoiding all the complexities associated with indicators.
Price action trading skills are also easily transferrable to all tradeable instruments including stocks, ETFs, bonds, and commodities among many others. Most indicators cannot be used across all asset classes and may stop working on assets where they used to work in the past. For example, the popular simple moving averages do not work well in range-bound market environments. Price action strategies work in all market environments because they can be tailored to fit any market environment as they are based on an asset’s actual price movements.
Disadvantages of price action trading
The main challenge for traders who are new to price action trading is that most of them are used to trading with indicators. Hence, they find it very difficult to switch to trading with naked charts, also known as price action trading. Most traders also expect to become experts at price action trading strategies without taking the time to understand the main concepts behind this trading style. No wonder they find it hard to learn price action trading strategies, the traders who become experts at price action trading strategies usually take the time to learn and apply what they have learnt in their trading activities.
PEOPLE WHO READ THIS ALSO VIEWED: