Understanding the basics of how financial markets work is one skill – identifying the right time to buy, sell, or hold a position is what determines if traders make a positive return on their trading. That’s where trading signals come in.
Signals based on technical indicators, or algorithm-based mathematical formulas, form the core of many trading strategies. Whether you’re trading manually or using a systematic model to trade automatically, it’s worth considering the signals on offer and which signals are used by the big institutional funds that dominate the market.
We’ve considered some of the most popular signals available at well-regarded broker Tickmill. Each of these signals can stake a claim to be included in your trading strategy. Picking the right signal to use can be crucial to your trading success. Read on as we analyse the foremost trading signals and sentiment resources that Tickmill provides.
Table of contents
Oscillator Indicator – Relative Strength Index
The Relative Strength Index RSI is a popular indicator used by all types of traders. The simplicity of the methodology behind this signal means that it is easy for beginners to pick it up and incorporate into their strategies. That same simplicity means that it is effective enough for intermediate and advanced traders to also use it to ascertain whether a market is ‘overbought’ or ‘oversold’.
The example provided in the below USDJPY H4 price chart shows the breach of the overbought level of 70. This is followed by a price fall, which reverses when RSI registers at 30, which is an oversold reading.
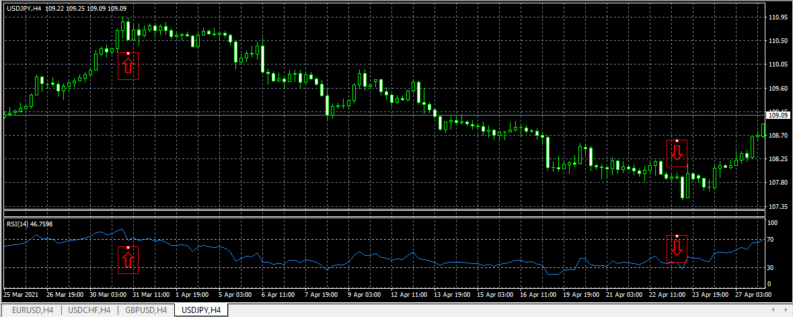
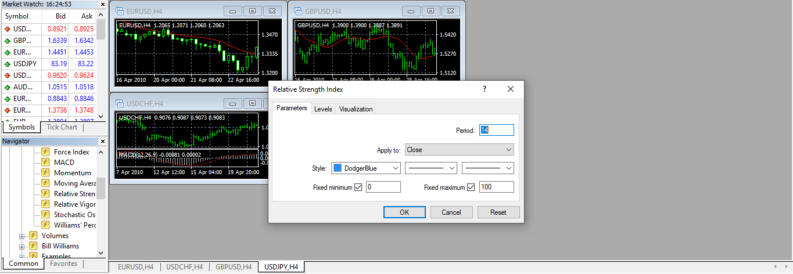
The RSI is a momentum oscillator that tracks historical price changes over a set period of time. A commonly used timeframe is 14 days, but at Tickmill, it’s possible to adjust the parameters to suit your approach. If you’re running a short-term strategy, for example, you can adjust the timeframe metric to hours, not days, or reduce (or increase) the number of periods to be different from the default ‘14’.
Trend Indicator – Bollinger Bands
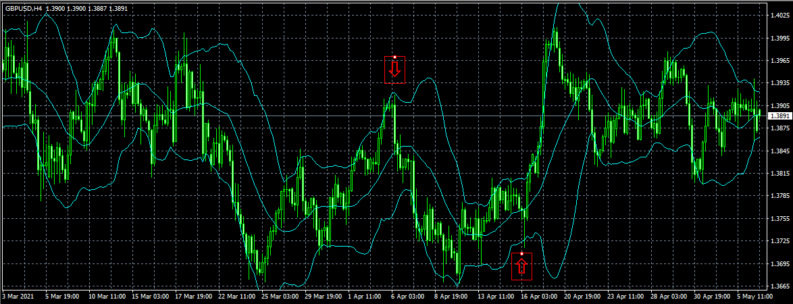
The Bollinger Band indicator available at Tickmill helps traders get a feel for volatility levels in the market and also provides buy and sell signals for those running momentum and momentum-reversal strategies.
Default metrics used on Bollinger Band charts measure price variance to two standard deviations. Moments when price reaches the upper or lower outer edge of the Bollinger channel reflect when price has moved to an extreme position in relation to the long-term Exponential Moving Average (EMA).
A price move towards the limit of the Bollinger Band can signal a reversal is imminent or that a breakout strategy might be a better option. The decision on which is more likely is down to the trader involved. But the bands mark a point when a lot of the market will be asking that question.
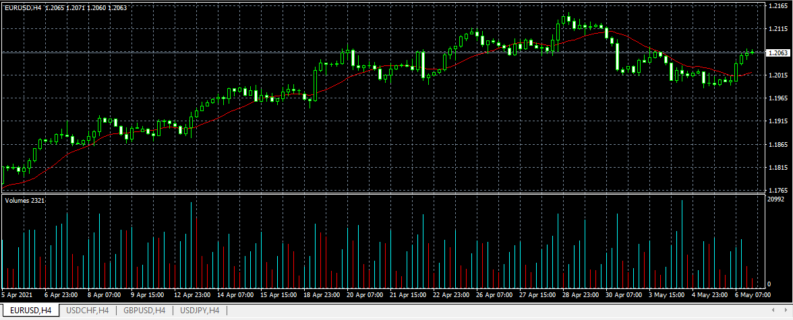
Volume Indicator – Tick Volume
One of the purest signals incorporated into trading decisions is trade volume – the theory being that time periods when more trading activity takes place results in stronger signals being given off. At that price point, a greater number of buyers and sellers have executed trades, so the resulting move, be it upwards or downwards, gives a better view of the newly formed consensus.
Tickmill supports traders by offering a variety of volume indicators. The simplest, ‘trade volume’, is highly customisable and allows traders to set their dashboard properties for an informed insight into market events.
In the below EURUSD price chart, a high-volume up-day is marked by a long blue candle, and down-days have red candles.
Benefits of Using Tickmill Trading Signals
We’ve selected just three signals from Tickmill’s extensive library of trade indicators. The list of available default indicators extends to more than 30 on the MT4 platform and 38 on the MT5 platform.
If you want to expand on that already impressive selection, you can download off-the-shelf signals provided by other traders, some of which are free to use. Developing your own using signals Wizards is also an option. The Expert Advisors area of the Tickmill platforms allows traders to develop and run fully automated trading programs with built-in signals.
The real beauty of the signals available at Tickmill extends beyond the number available. Each can be customised in terms of parameters used and appearance. Adding them to different charts is done by simply clicking a button or tapping a screen.
Signals can be applied to any asset group. So, whether you’re using your Tickmill account to trade forex, futures, commodities, cryptos, stocks, or indices, it’s simply a case of considering what timeframe you want to trade in and which strategy you want to apply.
It is worth remembering that traditional signals and indicators are calculated using historical data – they are lagging rather than leading indicators. They also work best when used in conjunction with each other so that the number of false signals can be limited. In short, there is still a lot of work needed to be carried out by traders to turn signals into profits.
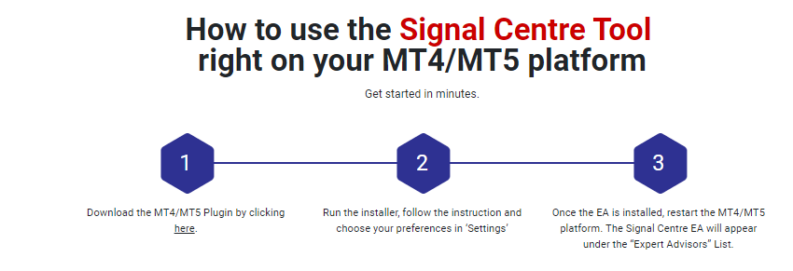
That’s where Tickmill’s Signal Centre helps the broker stand out from the crowd. It is a downloadable package that uses AI to crunch the abundance of data provided by software indicators and overlay trade entry and exit points onto price charts.
It saves clients endless hours of time spent on research and instead provides a selection of optimal trade entry and exit points for whatever market you want to trade.
Final Thoughts
Tickmill’s market-leading range of signals is backed up by a host of features. Notably, this broker is well regulated, offers super-fast trade execution times and bid-offer spreads as narrow as 0.0 pips.
The impressive range of trading signals available at Tickmill makes it easy for clients to incorporate a large number of technical analysis-based indicators into their trading. Whether you’re looking to fine-tune existing strategies or create a new model from scratch, the tools on offer at Tickmill make this broker an obvious choice.


