Technical analysis indicators are great tools for those looking to identify trade entry and exit points. But with so many available, it can be hard to establish which are the best to use. This situation is made harder by the fact that some, like the ever-popular Relative Strength Index (RSI) and Money Flow Index (MFI), are very similar in nature.
YOUR CAPITAL IS AT RISK
Filtering down the significant number of indicators available to a handy short-list can result in traders deciding which of two similar items they choose to keep. If you’re approaching the situation as a simple case of RFI vs MFI, then the below will help you decide which to keep.
Table of contents
Factors To Consider
RSI and MFI are two of the most commonly used and referenced technical indicators. For that reason, a full breakdown of how both are calculated and used has been created by AskTraders. Our guide to RSI and MFI tutorial are an ideal place to recap the essence of the approach both indicators take.
When comparing both indicators, it’s worth highlighting their similarities. Both are oscillators that identify when a market trend might have become overextended. They provide a contrarian signal that a price reversal could be imminent.
If market sentiment has been bullish, then they provide a numerical measure of the extent to which it is ‘overbought’. If prices are falling, they identify the price levels at which markets might be ‘oversold’.
Both are easy to use and are proven to be effective if applied to the right market conditions. It’s also possible to back-test their performance by pulling up a price chart and applying the indicator to your monitor.
The main technical difference between Relative Strength Index and Money Flow Index is that the latter incorporates the amount of trading activity, not just price moves.
This builds on the proposition that periods of high trade volume provide a clearer signal as to which way price will go next. If more buyers and sellers than usual have traded at a particular price point, that reflects both sides of a valuation ‘debate’ have been willing to commit real cash to their decision. When either sellers or buyers run out of steam, the other side will be in charge of the direction price takes.
It isn’t always the case that a formula with a greater number of variables is better than a more straightforward one. But the additional metric that forms part of MFI – market volume – is an intuitive one to include.
Divergence – MFI’s Prominent Advantage Over RSI
MFI’s advantage is the way that a divergence between the direction of its reading and the price of the underlying asset can point to a reversal being imminent. This helps traders be more patient before entering into trades and reduces the number of false signals.
If, for example, the oil market has experienced a bull run and taken the MFI on the daily price chart above 80, then it is considered overbought. The obvious option is to sell the market. But markets can continue in overbought mode for extended periods of time and result in traders making significant losses. It might be the case that oil’s price rise is due to heightened geopolitical concerns, which overrides the signal given by technical indicators.
Analysts who use Money Flow Index can afford to be patient and not simply wait for moments when MFI breaches 80 or 20. By adding this extra degree of sophistication, they can wait for moments when MFI and price diverge. The divergence, rather than the actual reading, is seen as the trigger to enter into a trade.
Despite this advantage, MFI has over RSI, if you scan analyst reports and market news updates, you’ll find RSI is mentioned far more often than MFI. The popularity of the RSI oscillator could come down to the simplicity of the formula rather than its effectiveness and establishing which is better for any individual trader is best done on a case-by-case basis.
RSI vs MFI – Case Study
When considering which of RSI or MFI to apply to your strategies, it’s best to run a comparative analysis of the market you are trading. That is exactly what research firm Stocksoft Research did for the period 2008–2018 and helped establish that, over that time, MFI outperformed RSI in the US stock market when trades had holding periods of three, five, and 10 days.
One of the basic rules of technical analysis is that things change, and the best strategy to use between 2008 and 2018 may not be the best one now. It is also important to factor in that if you are trading forex, commodities or cryptocurrencies, using stock market analysis may not be as valuable.
Therefore, the first step towards establishing which to use in your strategies is to back-test both indicators. In the below example, we consider a crypto investor with a long investment timeline considering buying Bitcoin.
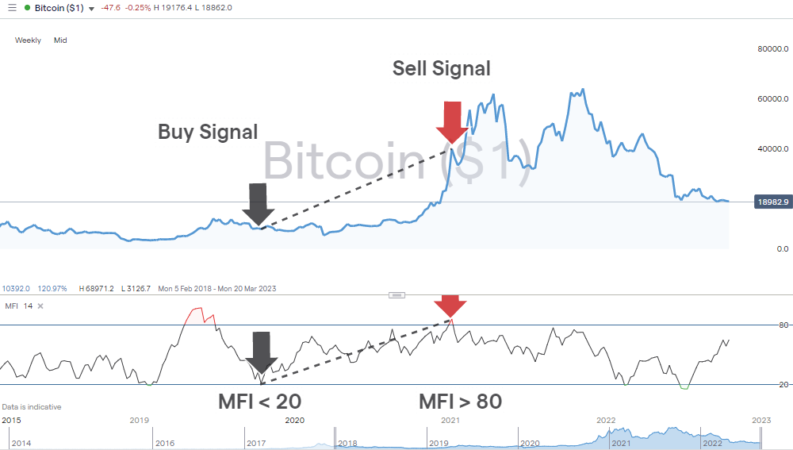
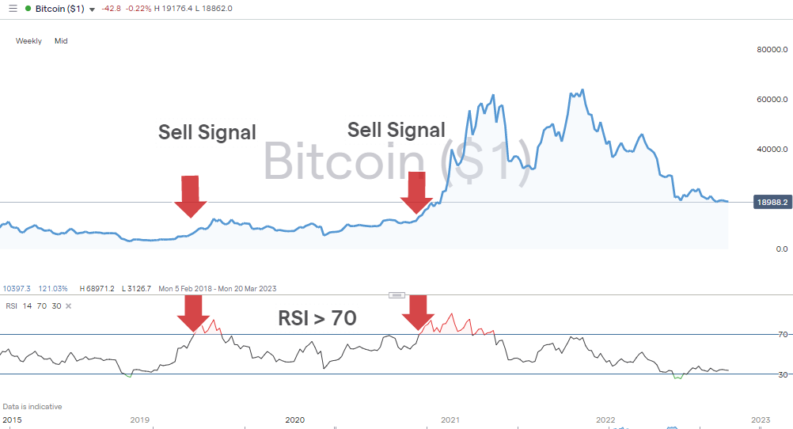
The first conclusion to draw is that the MFI signal was far more effective in this case study. The second is that the conclusions drawn up by the different metrics were dramatically different. Despite the similarities between the two indicators, MFI identified a buy and sell trade that was not only profitable, but in the opposite direction to RSI, which provided signals to enter into two loss-making short positions.
In terms of the formulae of both indicators, MFI may appear to be RSI with added extras. But as the case study shows, in terms of trading signals, the output from the two indicators can be decidedly different.
One historical case study of the notoriously volatile crypto markets doesn’t provide enough insight to come down on the side of MFI or RSI. In addition, the question of whether MFI or RSI is better shouldn’t be one that is answered and then not raised again. What works best now might not be the optimal option at a future time. To get around this challenge, the best approach is to run continuous testing of both indicators using a demo account.
Testing strategies using live current prices has the advantage of allowing you to trial the performance of the two indicators in the actual market you will ultimately be trading. It’s also quick and easy to set up a demo account and requires little more than an email address. The user-friendly software of good technical analysis brokers means you can run MFI and RSI strategies simultaneously in the same or different assets.
How To Use RSI And MFI
RSI is such a widely used metric that keeping track of it is always a good idea. Its simple-to-use reading can be applied to various time frames and it will come up in a lot of market reports covering an extensive range of asset groups.
The added complexity of MFI will often result in it being a more effective trade indicator. This is because the additional metrics relating to trading volumes are a good fit for the model. Data points to it being a more effective tool than RSI for momentum-based strategies with medium to long holding periods.
There are few hard and fast rules in the markets. While MFI is usually stronger, operating on a case-by-case basis is recommended. Testing and analysis are required but given how easy it is to perform, there are few obstacles to getting an up-to-date picture of the performance of both indicators.
It is also worth considering using a combination of technical indicators rather than just one. The Keltner Channel is a stochastic indicator that compliments the Money Flow Index. They both look for the same build-up of momentum, but in different ways.
Heiken Ashi candles are another trend-spotting strategy to consider using with either RSI or MFI. That approach involves studying the nature of specially designed candlestick charts, which pinpoint when a new trend might be forming.
A more pertinent question for any trader would be what risk-reward they want to apply to their strategies. The standard overbought and oversold levels for RSI and MFI are 70 / 30, and 80 /20, respectively. A conservative trader may adjust those levels to 75 / 25, and 85 / 15 and find those a better fit. Managing risk and trading psychology in that way and taking control of what indicators can offer is as important as the characteristics of the indicator itself.
Final Thoughts
If forced to choose between Relative Strength Index and Money Flow Index, then the MFI indicator would typically be the best choice. The additional variables incorporated into the MFI methodology make sense and are backed up by historical data that points to MFI generating better returns.
The RSI does have a role to play. Not only because of its popularity and prominence in market reports. There will also be times when market conditions dictate that RSI outperforms MFI.
That makes it the wiser choice to consider both, monitor both, and be open to the idea of using both – ideally in conjunction with other indicators. Selecting a group of complementing indicators that are appropriate for current market conditions is an ideal first step.
Testing RSI and MFI trading models is the first part of the process and moving on to trusting them to trade real money is a big step to take. With that in mind, applying patience can improve your trading bottom line. Of equal importance is the need to use a trusted broker. This list of trusted brokers at AskTraders includes firms that have all the tools to help your trading get off to the best possible start.
People Who Read This Also Viewed:


