The Cup and Handle Pattern Explained
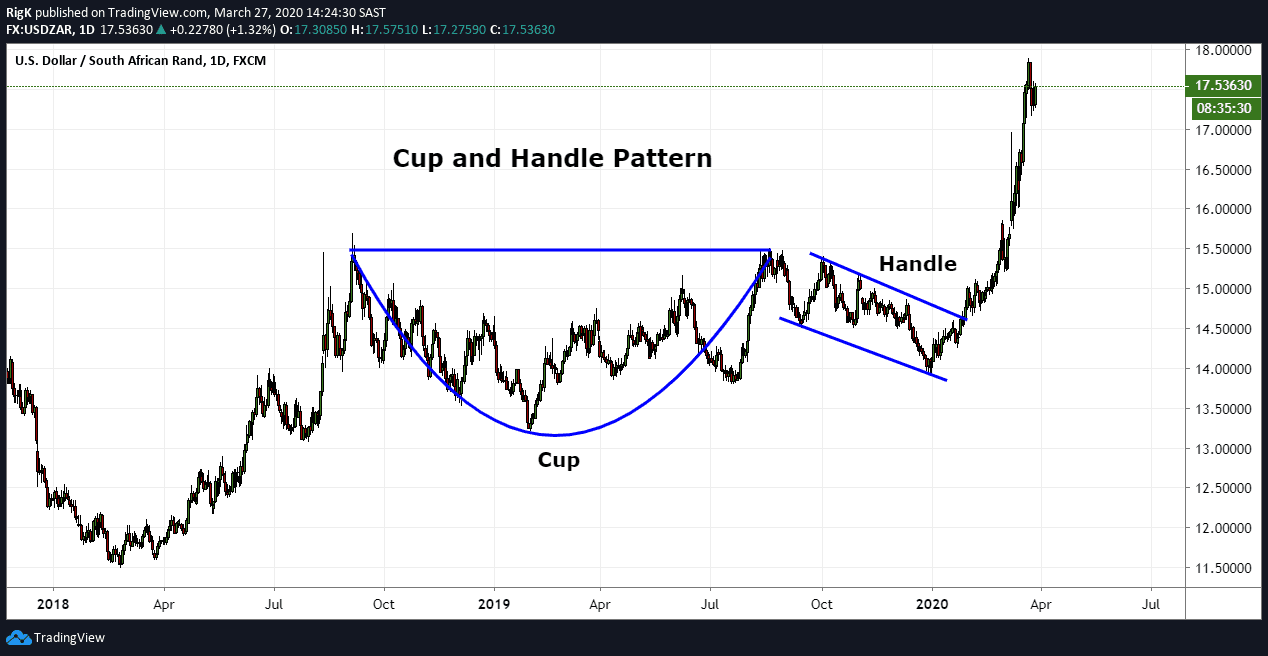
The cup and handle pattern is considered to be a bullish continuation pattern and consists of a U-shape bottom and a handle that together resembles a teacup.
My first chart above shows a cup and handle pattern on the USD/ZAR currency pair that took more than a year to form and that ended in early 2020 before price broke out of the pattern and resumed the upward trend.
The handle part of the entire pattern can often be defined by using trendlines and tend to drift lower following a corrective structure that should ideally not retrace too much of the cup’s depth. Once price breaks out of the handle’s consolidation or corrective phase, then the entire cup and handle pattern is considered complete.
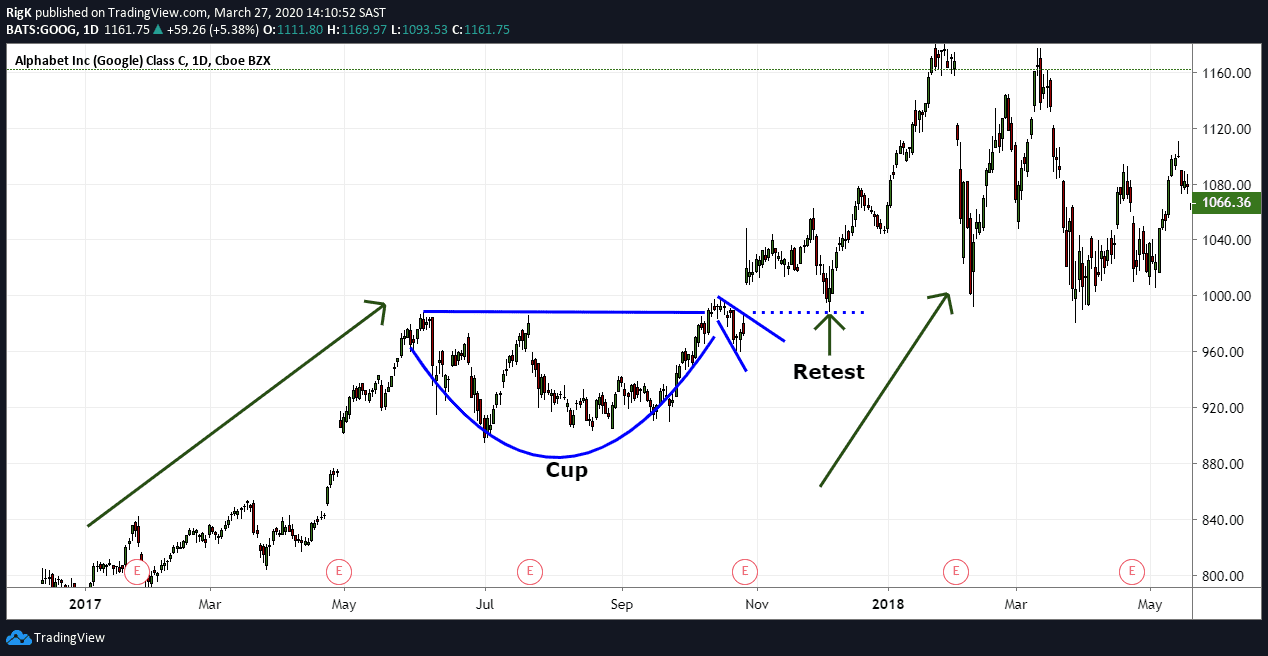
Here is another cup and handle pattern that formed in Google during the second half of 2017. Note that not all cup and handle formations will be perfect, like in this example where the handle started forming slightly above the horizontal part of the cup.
When the pattern completed, price gapped above the cup but offered another opportunity, later on, to buy Google stock when price pulled back and retested the upper part of the teacup.
How to Trade the Cup and Handle Pattern
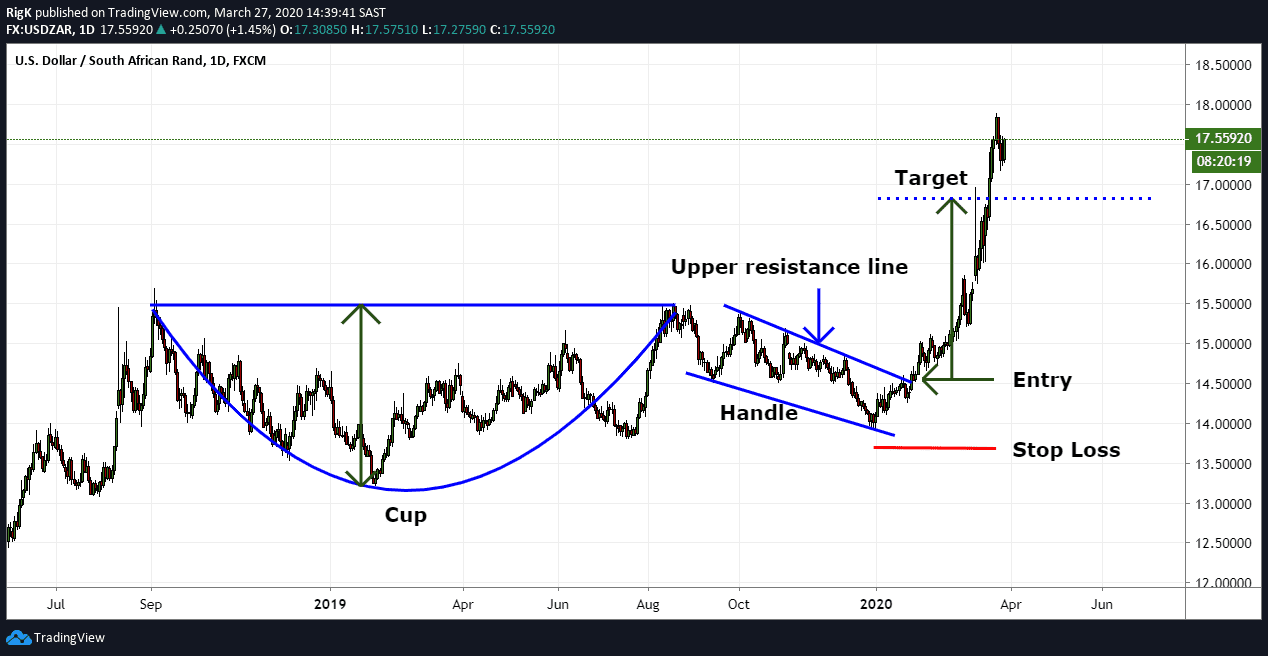
Since this is a bullish continuation pattern, aggressive traders will often execute a buy order as soon as price breaks above the upper resistance line of the handle but conservative traders will typically wait for price to break and close above the upper line and only enter if price retests the resistance line.
Sometimes, however, the resulting breakout higher could be so strong that price will not retest the resistance line again, resulting in a trader missing out on an opportunity to buy.
A profit target can be determined by measuring the distance from the lowest bottom within the cup and extending that same distance upwards from the breakout level. Once a long position has been executed a stop loss can be placed below the lowest point of the handle, assuming that your reward potential exceeds the total amount of risk you are taking on.
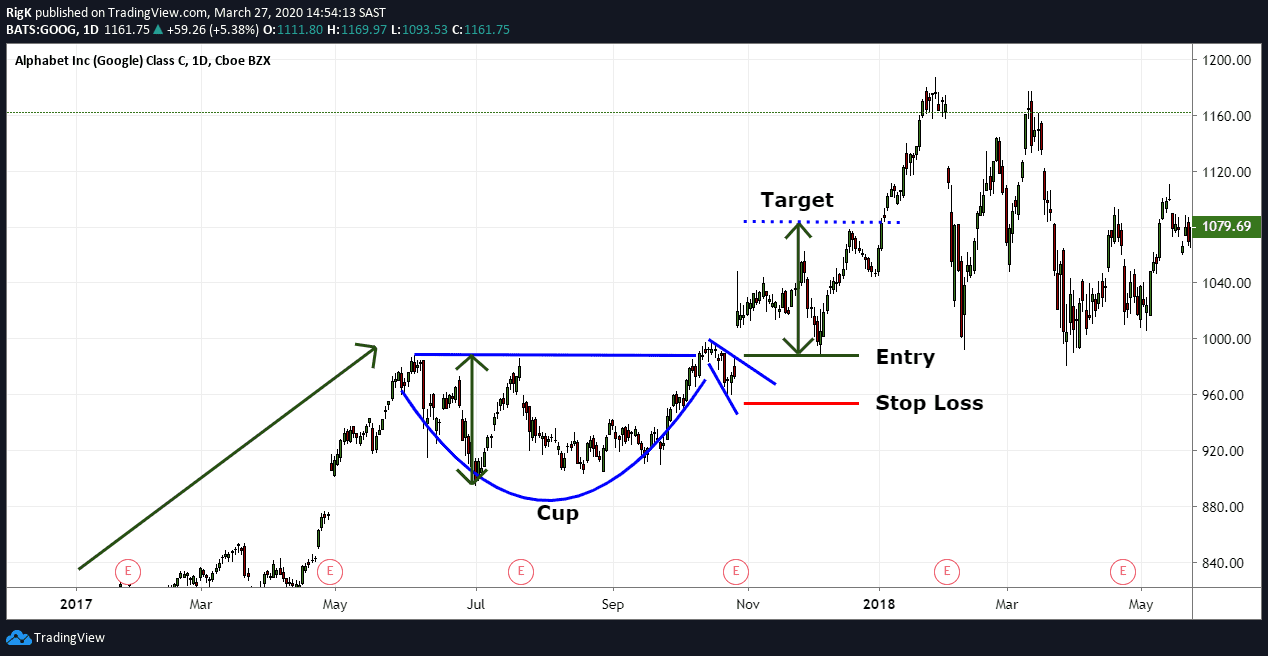
The final chart shows how a long position in the previous example of Google would have planned out. Although Google gapped above the upper resistance line of the handle after an earnings announcement, price did pull back to the same level where the breakout occurred and offered a perfect buying opportunity.
The presence of a cup and handle pattern is a strong technical indication of a bullish continuation and is one of the easier trading patterns to spot on a chart with clearly defined entry, stop loss and target placement guidelines.
PEOPLE WHO READ THIS ALSO VIEWED:
