The Ichimoku Cloud indicator provides traders with a collection of technical metrics capable of outlining directional trend momentum and support/resistance levels in any financial market.
YOUR CAPITAL IS AT RISK

Using multiple moving averages, the trading system plots a “cloud” structure against market prices to forecast where an asset’s value might travel in the future.
These tools can help traders identify the market’s dominant trend (bullish or bearish) and determine an appropriate time to enter/exit active positions to achieve maximum profitability.
What exactly is Ichimoku Kinkō Hyō
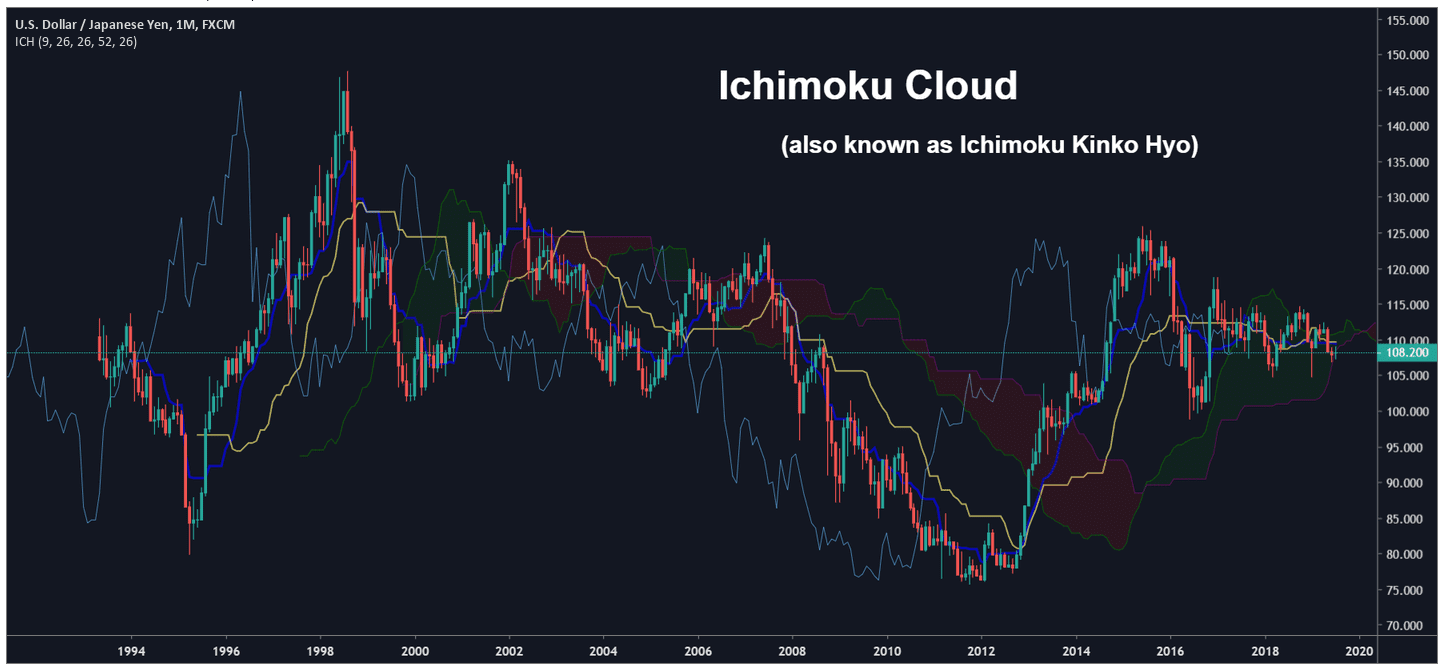
Designed by Goichi Hosoda in Japan in the 1960s, the Ichimoku system provides traders with additional data points compared to traditional candlestick charts.
At first glance, the Ichimoku Cloud (and the signal lines that make up its parts) might seem like an overly complicated abstract art piece.
However, once traders develop experience reading these charts (and identifying the signals those charts display), the process becomes much less intimidating.
Let’s take a look at the name of the trading system itself, as this translation provides us with a lot of information about its goal and design:
- Ichimoku translates to “one glance” or “a single view.”
- Kinkou translates to “equilibrium” or “balance.”
- Hyo translates to “graph” or “chart.”
In practical terms, the Ichimoku technique works as an all-in-one trading system that’s ideal in its ability to filter between positive and negative market phases:
- When price moves above the Cloud, the major trading signal is bullish (long signal).
- When the price moves below the Cloud, the major trading signal is bearish (short signal).
- When price moves into the Cloud, choppy price action is expected (and no trading activity should be initiated).
Within these dominant trend signals, the Ichimoku system also displays internal signals that can be used to validate/confirm the future price projections made by the Cloud. To understand these minor trading signals, we must take apart the system and examine its parts.
YOUR CAPITAL IS AT RISK
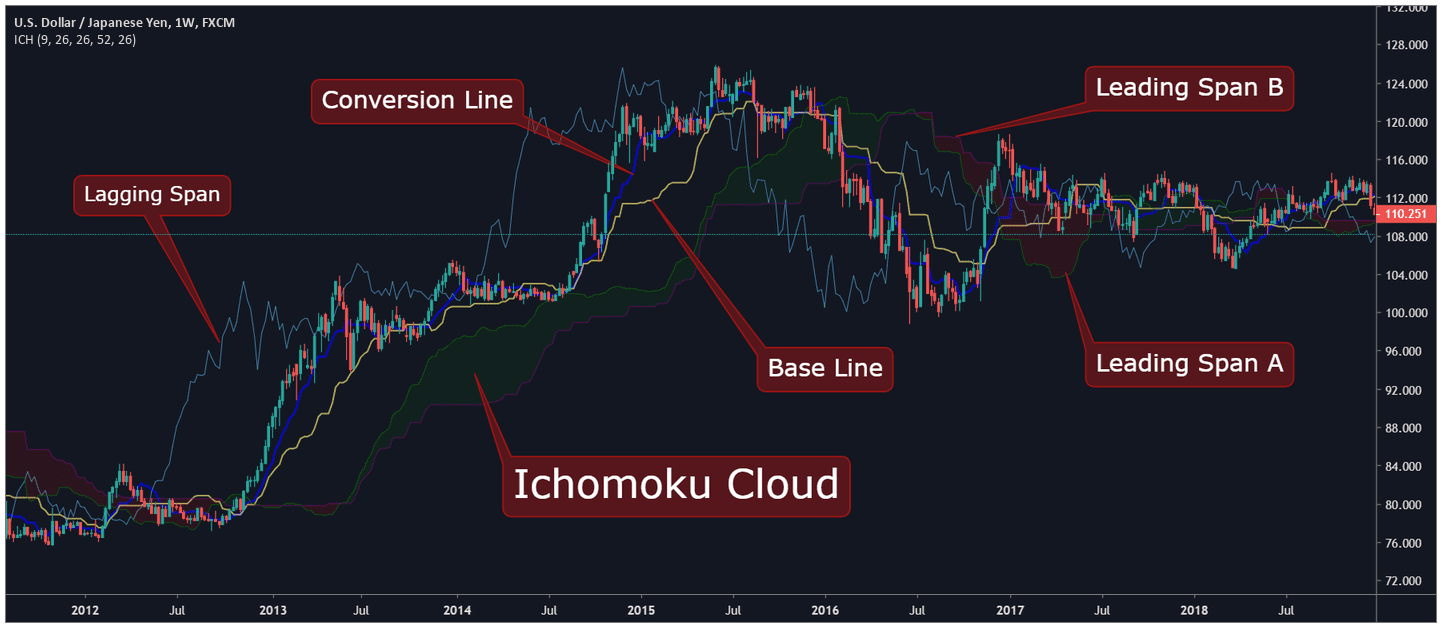
The calculations which create the total Ichimoku Cloud system include five different minor indicators:
- Leading Span A – green line at Cloud edge (also referred to as Senkou Span A)
- Leading Span B – red line at Cloud edge (also referred to as Senkou Span B)
- Conversion Line – dark blue line (also referred to as Tenkan Line)
- Base Line – yellow line (also referred to as Kijun Line)
- Lagging Span – light blue line (also referred to as Chikou Span)
Trader’s Terminology: The Japanese word for “Cloud” is “Kumo” and the Japanese word for “Line” is “Sen.” Therefore, in practice, a related phrase like “Tenkan-Sen” would simply refer to the Tenkan Line (or Conversion Line). Similarly, the phrase “Kijun-Sen” would refer to the Base Line, while “Chikou-Sen” refers to the Lagging Span.
Traders actively using these techniques will often refer to Ichimoku signals using their original names. Thus, it’s essential to have an understanding of the nomenclature.
The Best Demo Accounts
eToro: 51% of retail CFD accounts lose money
Take a lookIG: FCA Regulated
Take a lookTo master a new trading strategy you need to practice it. Testing out your strategy in a demo account means you can master it without risking your hard-earned capital. Here we have picked out for you three of the best demo accounts around.
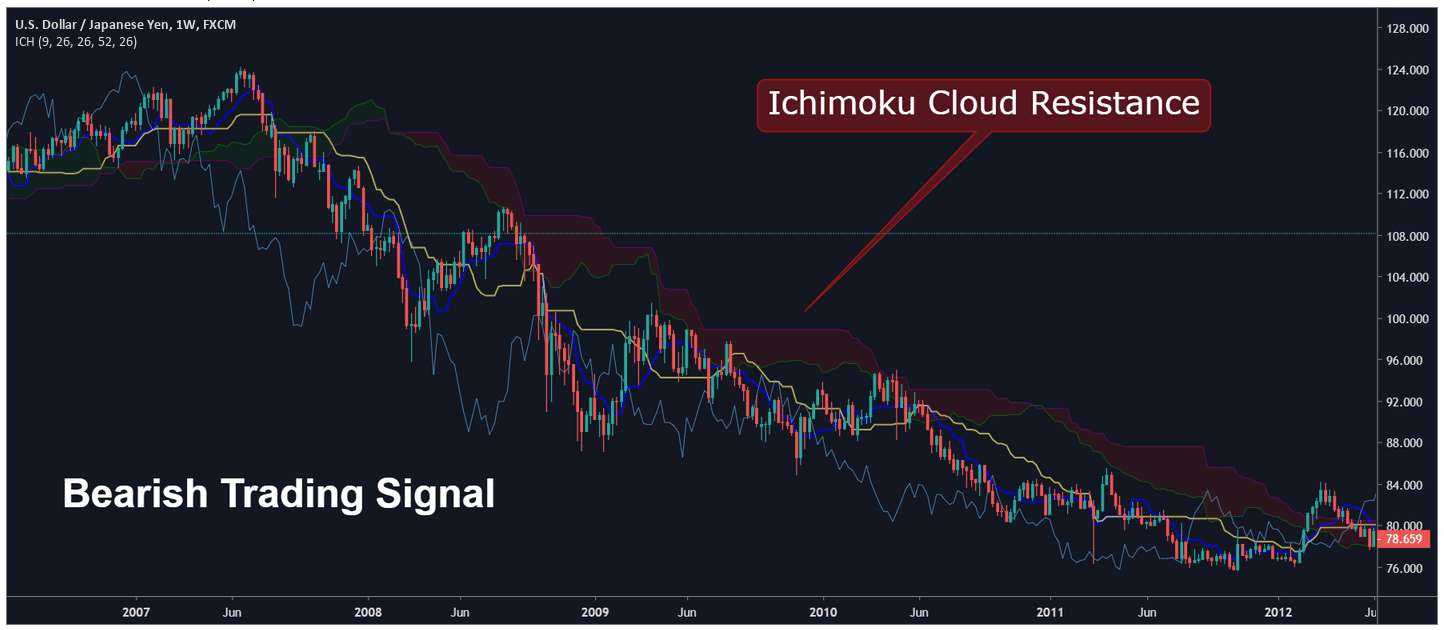
Ichimoku Kumo: Cloud Support and Resistance
The most significant element of the Ichimoku strategy lies in the directional behavior of the Cloud. Here, we can see the Ichimoku Cloud is moving in the downward direction and is working as price resistance (note that the color of the cloud is almost entirely red):
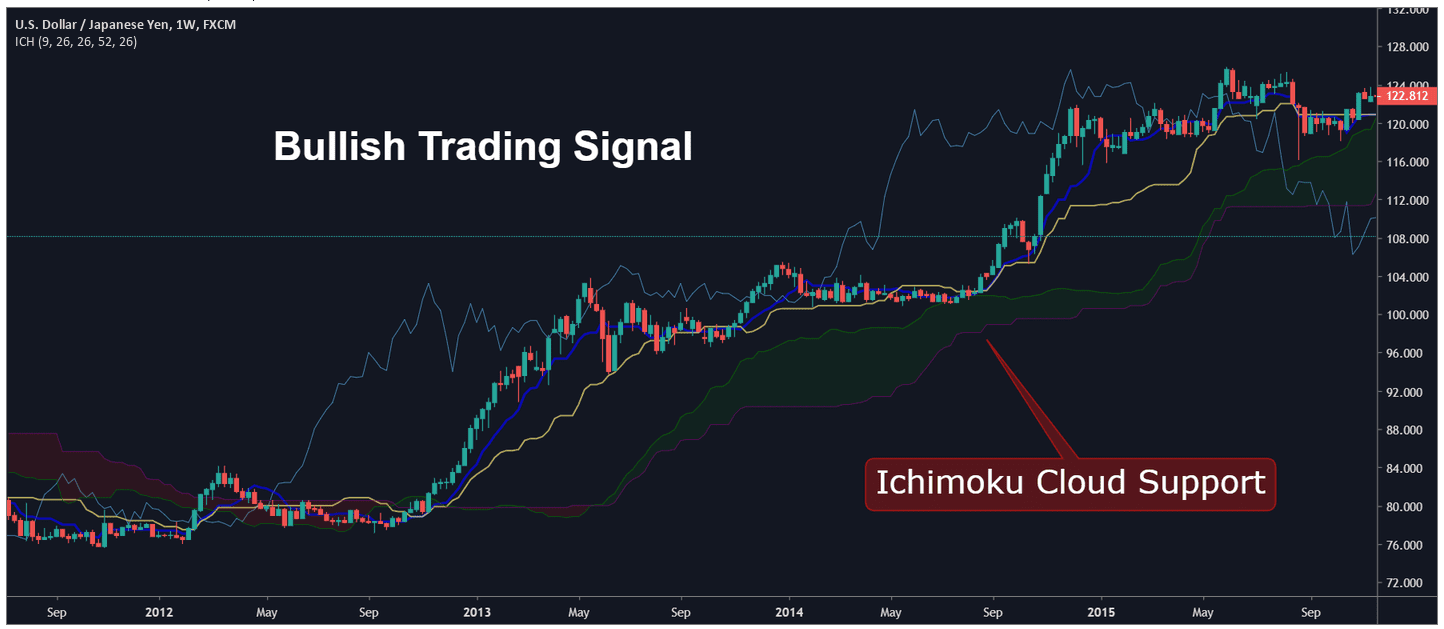
In the next example, we can see the Ichimoku Cloud is moving in the upward direction and is working as price support (note that the color of the cloud is almost entirely green):
Ichimoku System Component Lines: Common Interpretations
Leading Span A and Leading Span B work together to compose the larger Ichimoku Cloud structure and their combined direction determines the color of the clouded space (usually red during bear markets or green during bull markets).
Leading Span A is the faster-moving Cloud boundary, calculated as the average (or mid-point) between the Base Line and Conversion Line:
(Base Line + Conversion Line ) / 2
Leading Span A measures price momentum and can work as a support level (when below market price) or resistance level (when above market price). This line is referred to as a “leading” marker because its calculation is predictive: Leading Span A plots values 26 periods into the future and its readings are incredibly informative when placing individual trades.
Leading Span B is the slower-moving Cloud boundary, calculated as the average of the 52-period low and the 52-period high:
(52-day low + 52-day high) / 2
Traders consider Senkou Span B to be the “slower” aspect of the Cloud boundary because its calculation draws on 52 periods worth of price data. Remember, Senkou Span A uses data based on shorter time intervals and this means it reacts more quickly to changes in price.
YOUR CAPITAL IS AT RISK
Ichimoku Cloud: Identifying Strong Trends
Using the Ichimoku cloud strategy may be a good trading trick. However, how do you indicate and identify strong trends by using the clouds?
You can identify the strength of a trend by observing the angle of the cloud. In Ichimoku Cloud, a strong bullish trend is apparent when the cloud is rising upwards at a steep angle.
On the other hand, a strong bearing is usually in place when the cloud is going lower at a steep angle. While sometimes, the clouds will form behind the price action, and are known as Kumo shadows.
A Glance at Ichimoku Cloud System
Buy Signal
- Price rises above the Komu or cloud
- Kumo turns from red to green
- Price moves above the Kijun Sen
- Tenkan Sen rises above the Kijun Sen
Sell Signal
- Price falls below the Komu or cloud
- Kumo turns red from green
- Price moves below the Kijun Sen
- Tenkan Sen falls below the Kijun Sen
Secondary Ichimoku Lines: Conversion Line, Base Line, and Lagging Span
The Conversion Line, Base Line, and Lagging Span create additional (minor) signals which can be used to confirm (strengthen) the outlook visible in the dominant trend of the Cloud structure.
The Conversion Line is the fastest-moving signal line on the entire Ichimoku indicator and is calculated as the mid-point of the 9-period low and the 9-period high:
(9-day low + 9-day high) / 2
The Conversion Line quickly reacts to changes in price, so its slope indicates the dominant direction in short-term market trends. The Conversion Line operates as its own indicator but also works as a component in the formula which defines Leading Span A.
The Base Line is calculated as the average of the 26-period low and the 26-period high:
(26-day low + 26-day high) / 2
The Base Line works as an indicator of price momentum capable of assessing trends during short-term and medium-term intervals. The Base Line can also generate trading signals when used in conjunction with other elements of the Ichimoku system. To accomplish this, the Base Line is often used in combination with the Conversion Line (faster-moving 9-period line plot) to identify potential trend reversals.
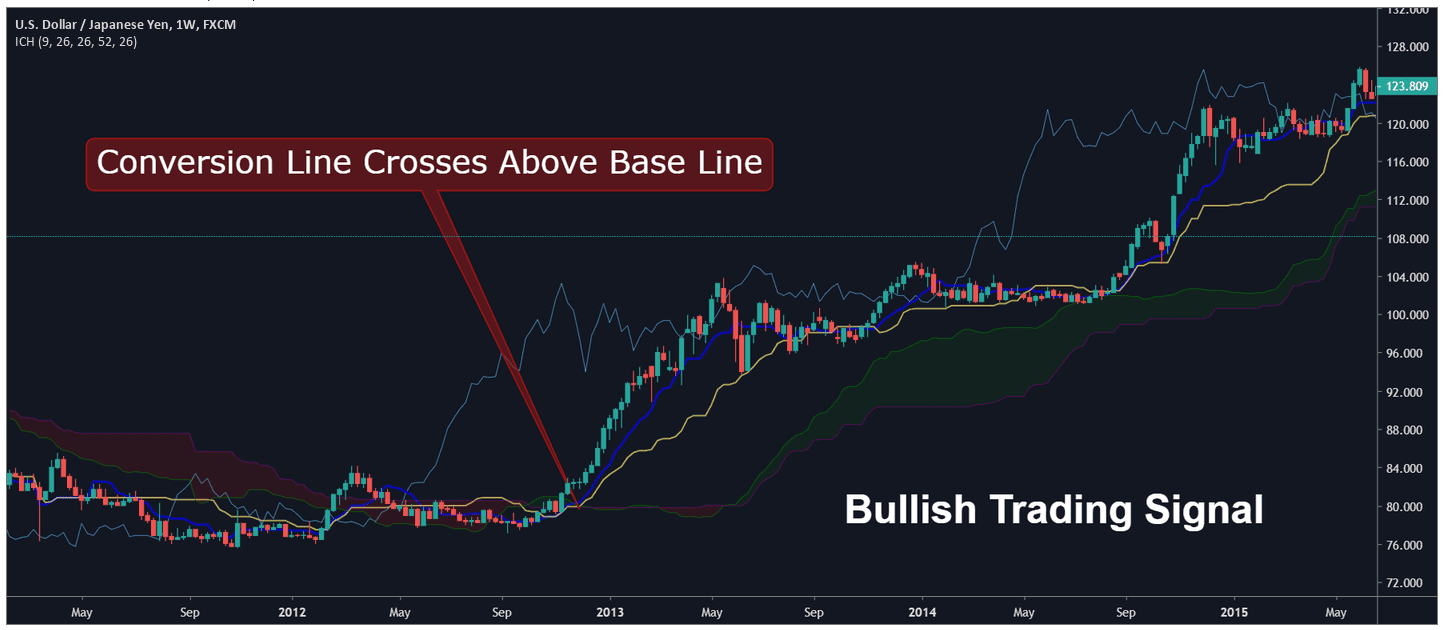
When the Conversion Line crosses above the Base Line, an early bullish trading signal is in place:
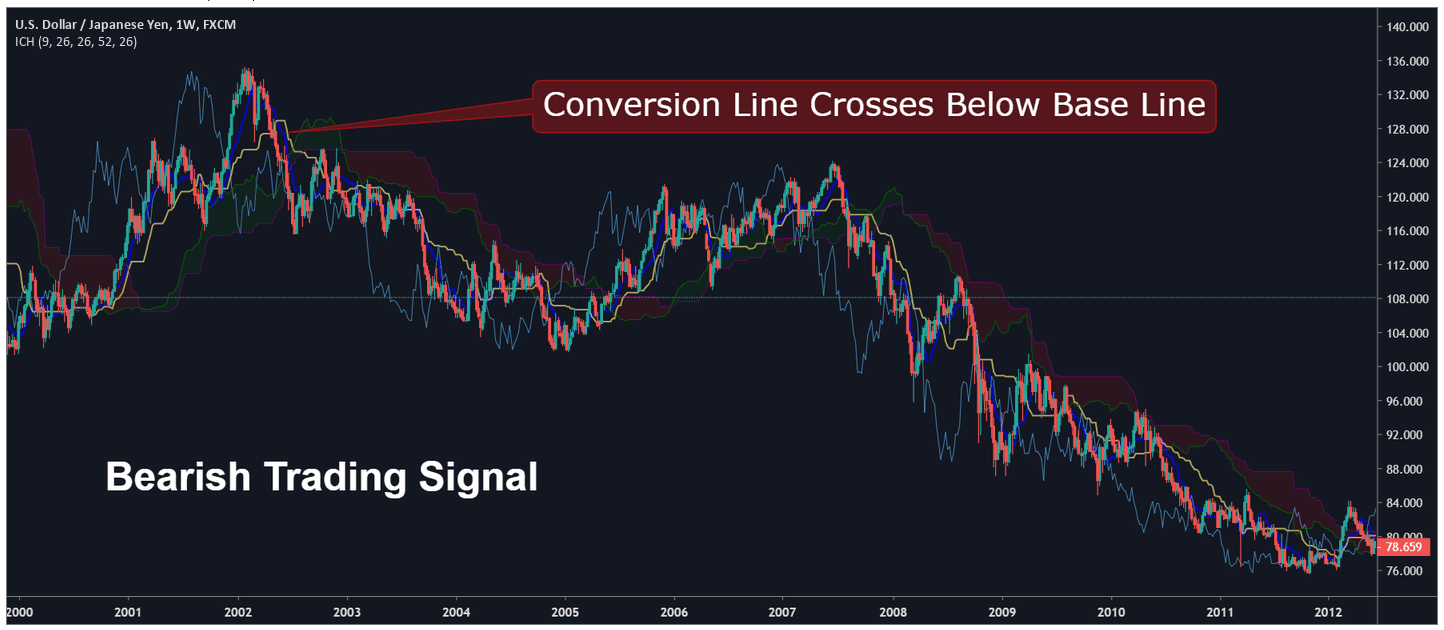
When the Conversion Line crosses below the Base Line, an early bearish trading signal is in place:
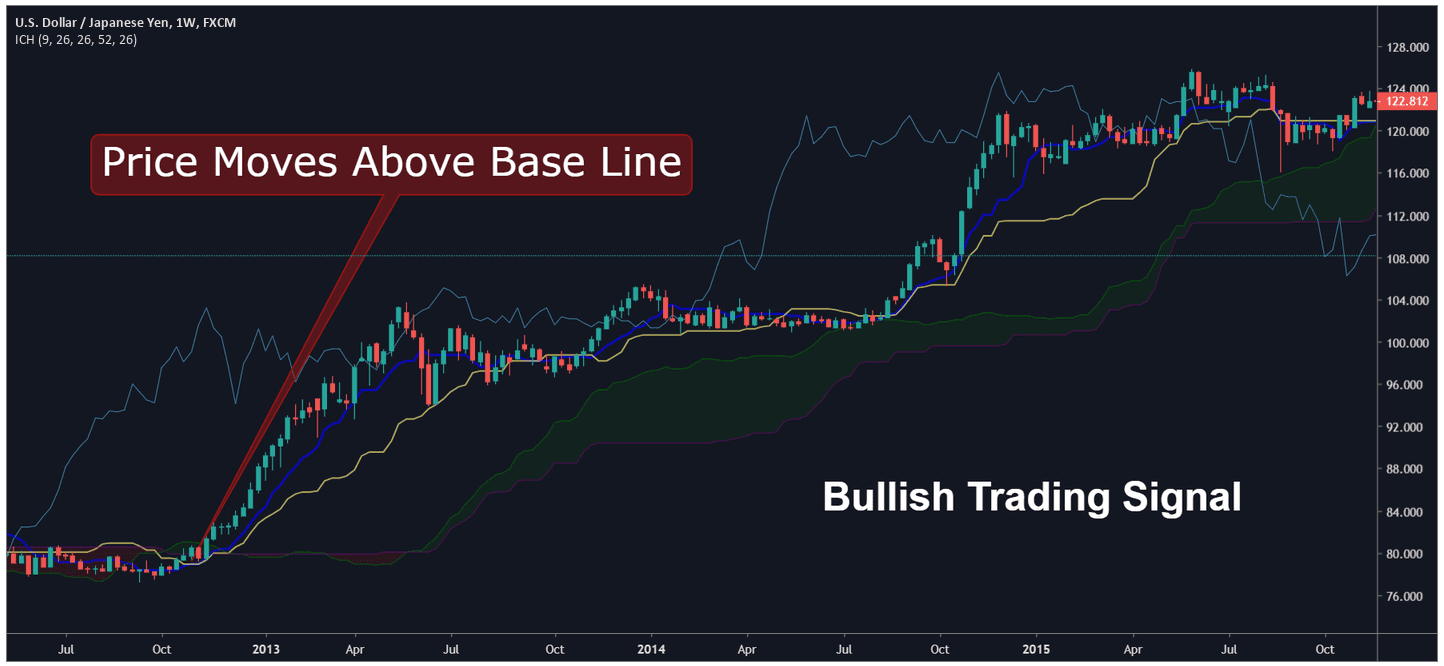
Typically, the Base Line isn’t used in isolation. Instead, its signals are used in combination with the other elements of the Ichimoku system. However, it can be said that short-term to medium-term momentum is positive (bullish) when price moves above the Base Line:
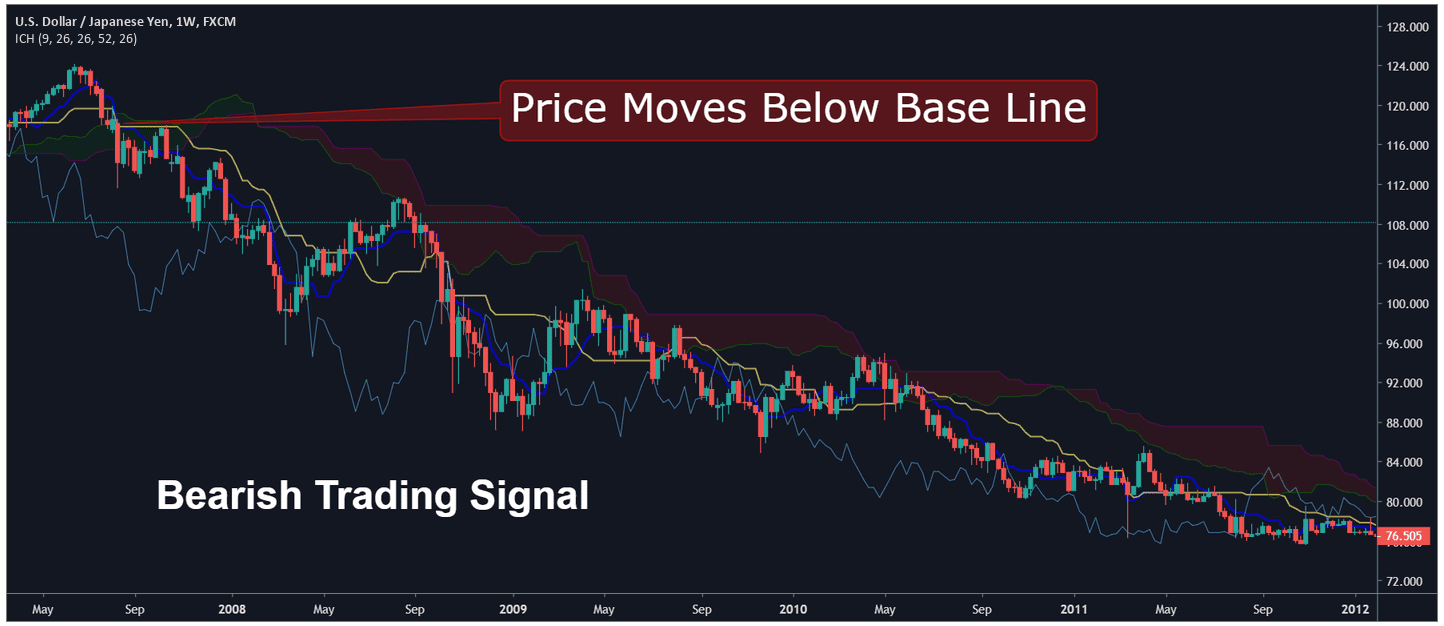
Conversely, short-term to medium-term momentum is negative (bearish) when price moves below the Base Line:
The Lagging Span is plotted using the closing price of an asset 26 periods in the past. In other words, if we look at the most recent closing price of an asset and shift it backward by 26 price bars, this will give us the current value of the Lagging Span. By design, this metric allows us to visualize relationships that exist between the asset’s past market trends and its current price behavior.
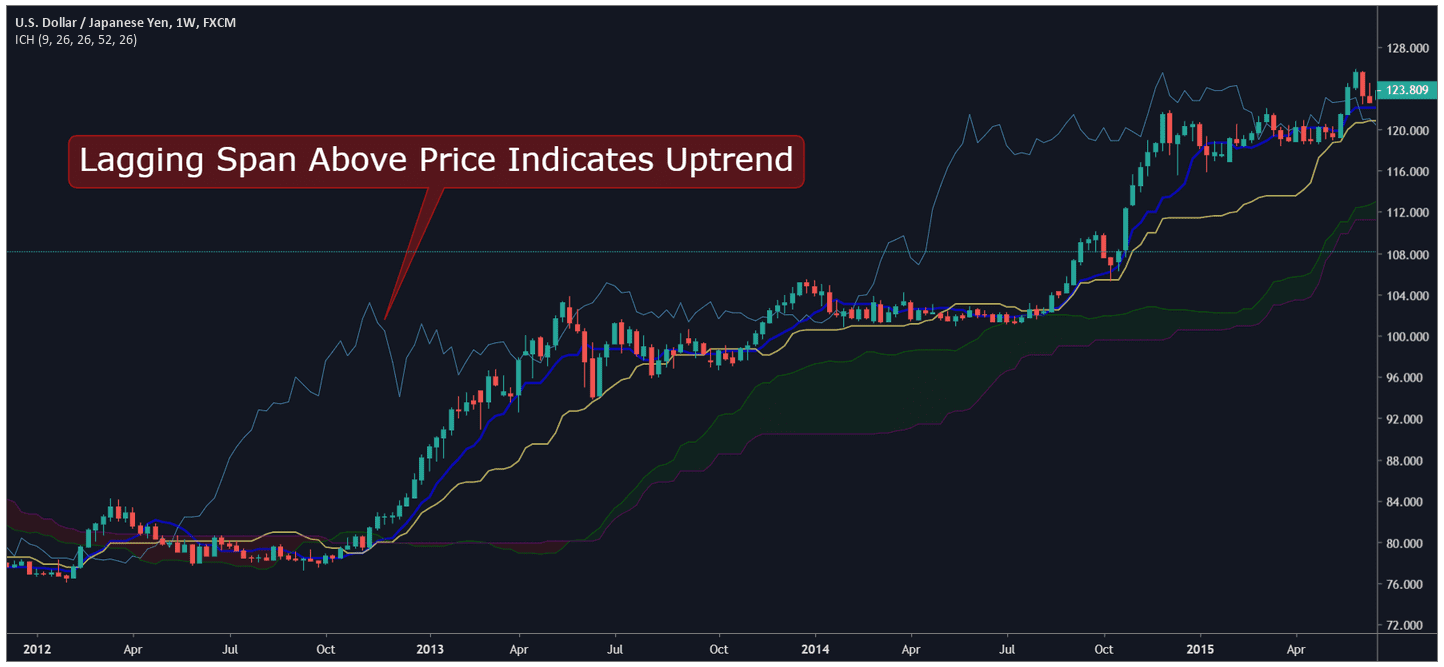
The Lagging Span can also alert traders to potential trend reversals. When the Lagging Span crosses above prices on the Ichimoku chart, traders will interpret the environment as positive (a bullish trend is in place) and view this as a final trading confirmation for long positions:
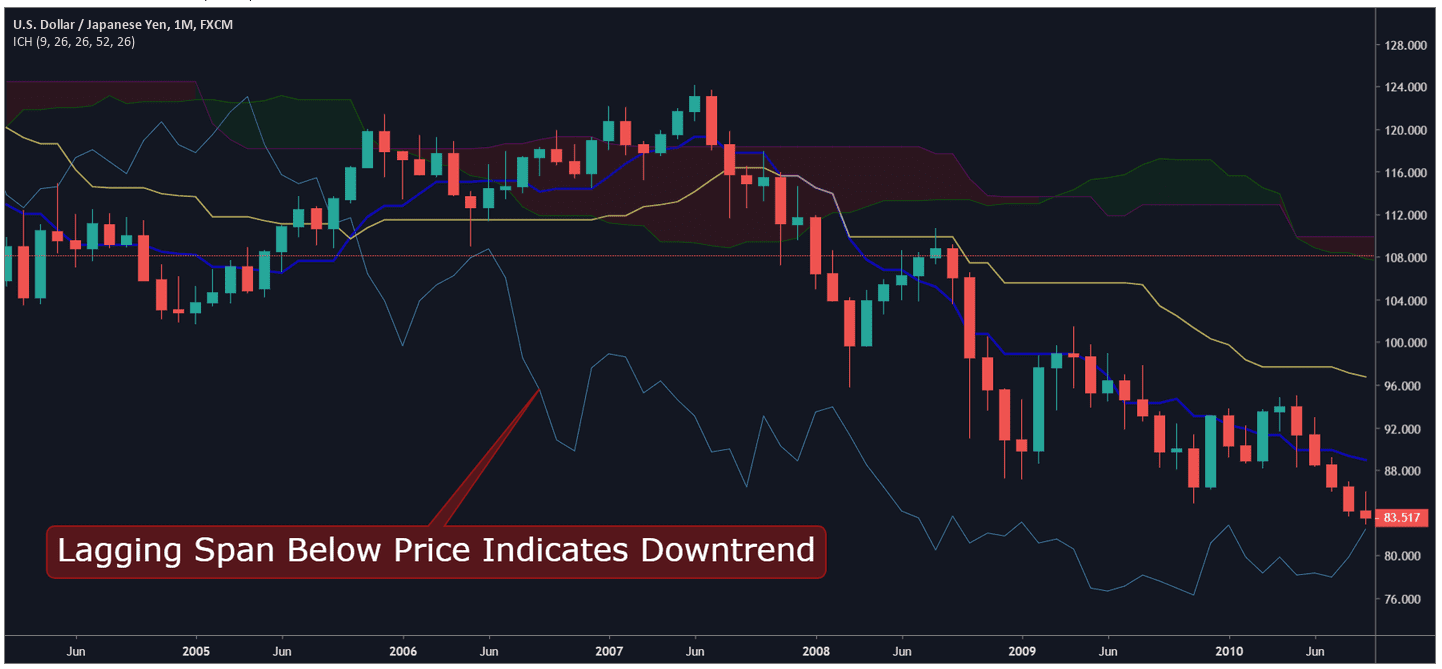
When the Lagging Span crosses below prices on the Ichimoku chart, traders will interpret the environment as negative (a bearish trend is in place) and view this as a final trading confirmation for short positions:
As we can see, trading strategies using the Ichimoku system attempt to identify probabilities in future price direction. These strategies can help traders isolate the dominant trend and locate suitable opportunities to enter/exit during most market environments. While Ichimoku trading might seem complicated and intimidating when it’s first introduced, traders that are familiar with the system are able to analyze these charts quickly and spot trading opportunities as they develop.
YOUR CAPITAL IS AT RISK
Real-Time Trading Examples: Ichimoku Strategy
In the first example, we can see prices begin at low levels toward the right of the price chart. Bitcoin prices begin to move higher and we see several technical signals which point to opportunities in long positions.
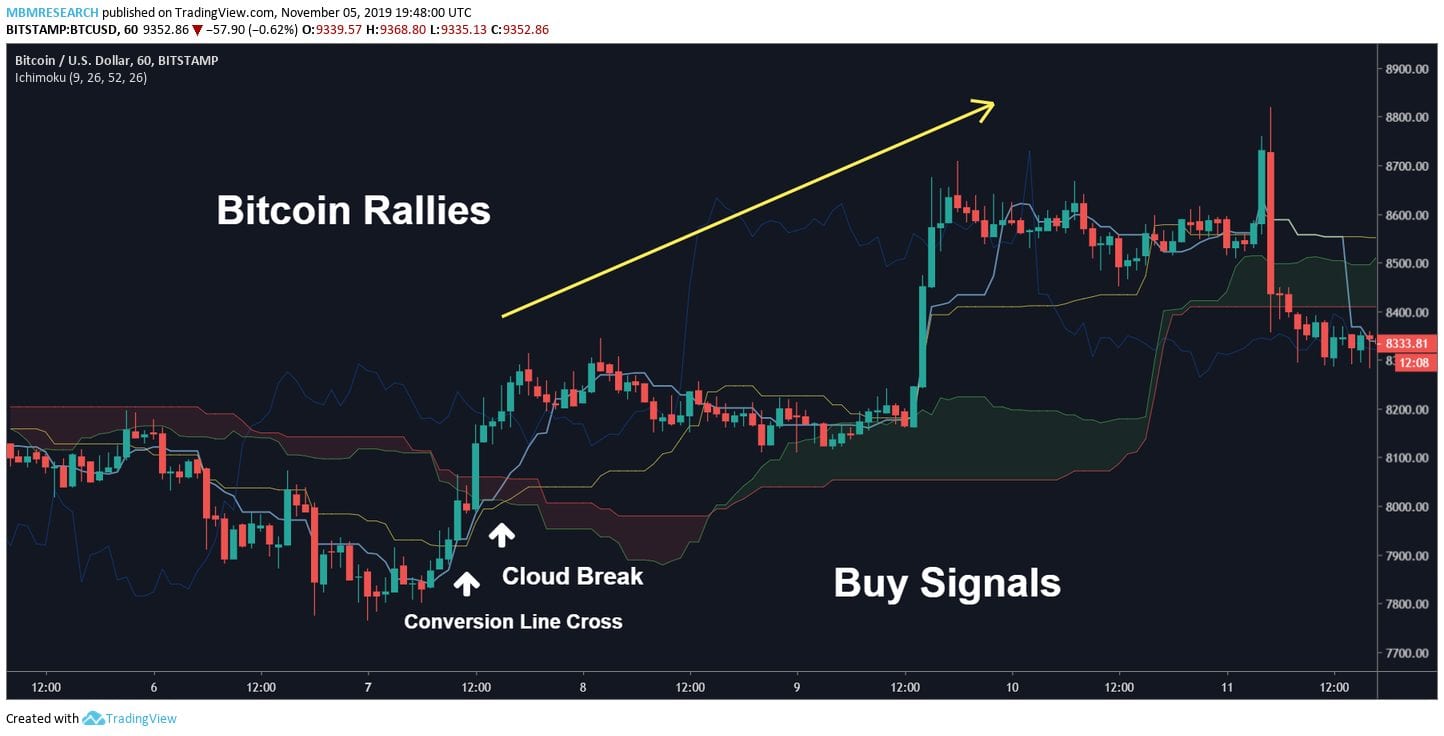
Bitcoin prices move above the Ichimoku Cloud after a bullish cross in the Conversion Line becomes visible on the hourly chart. After confirming these two buy signals, a long position could be initiated at $8,080. Stop losses could be placed below the prior lows (at $7,810). To find our profit target, we multiply 3x the total risk of loss on the trade, which gives us a value of roughly $8,500. As prices approach these levels, we close the position and collect profits.
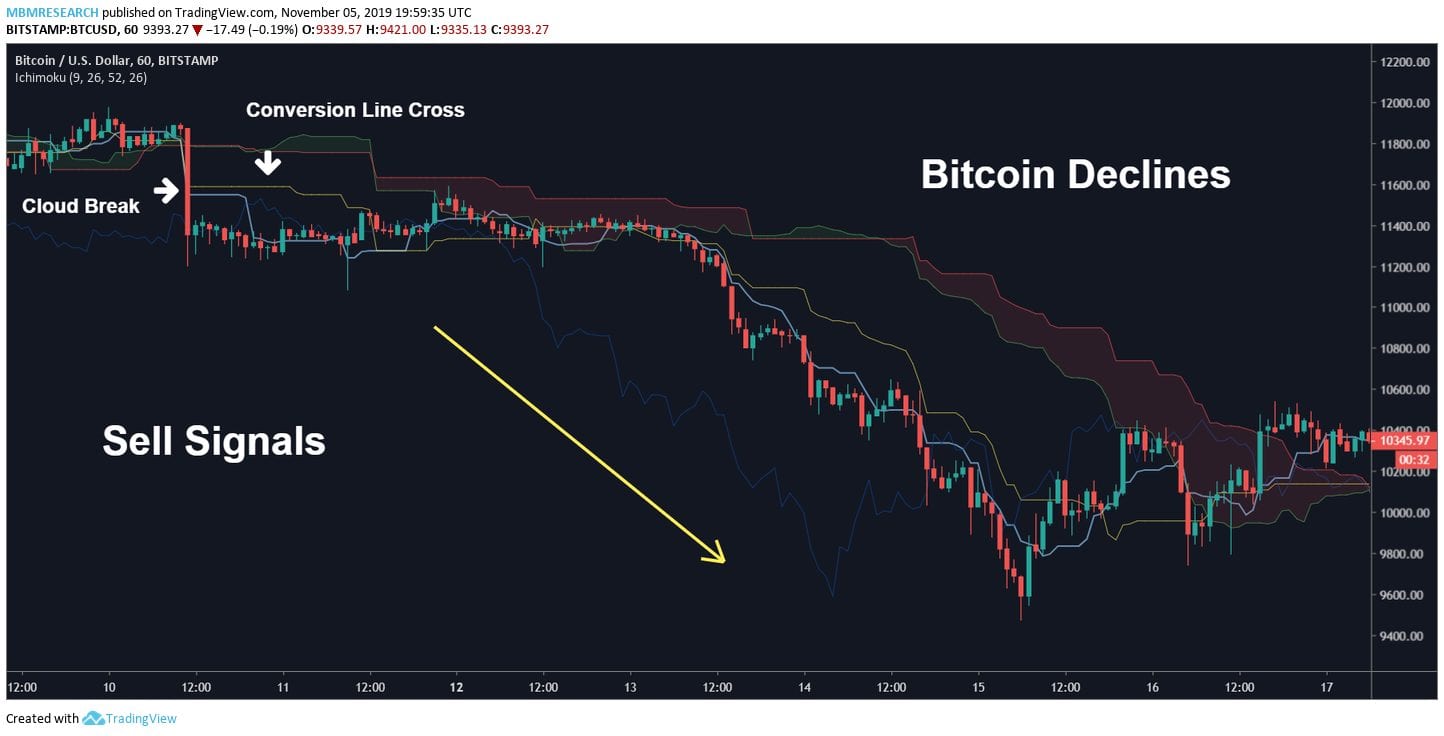
In the second real-time trade example, we can see a bearish scenario that would help us to establish short positions. Bitcoin breaks below the Ichimoku Cloud $11,560 and the Conversion Line crosses below the Base Line on the hourly charts.
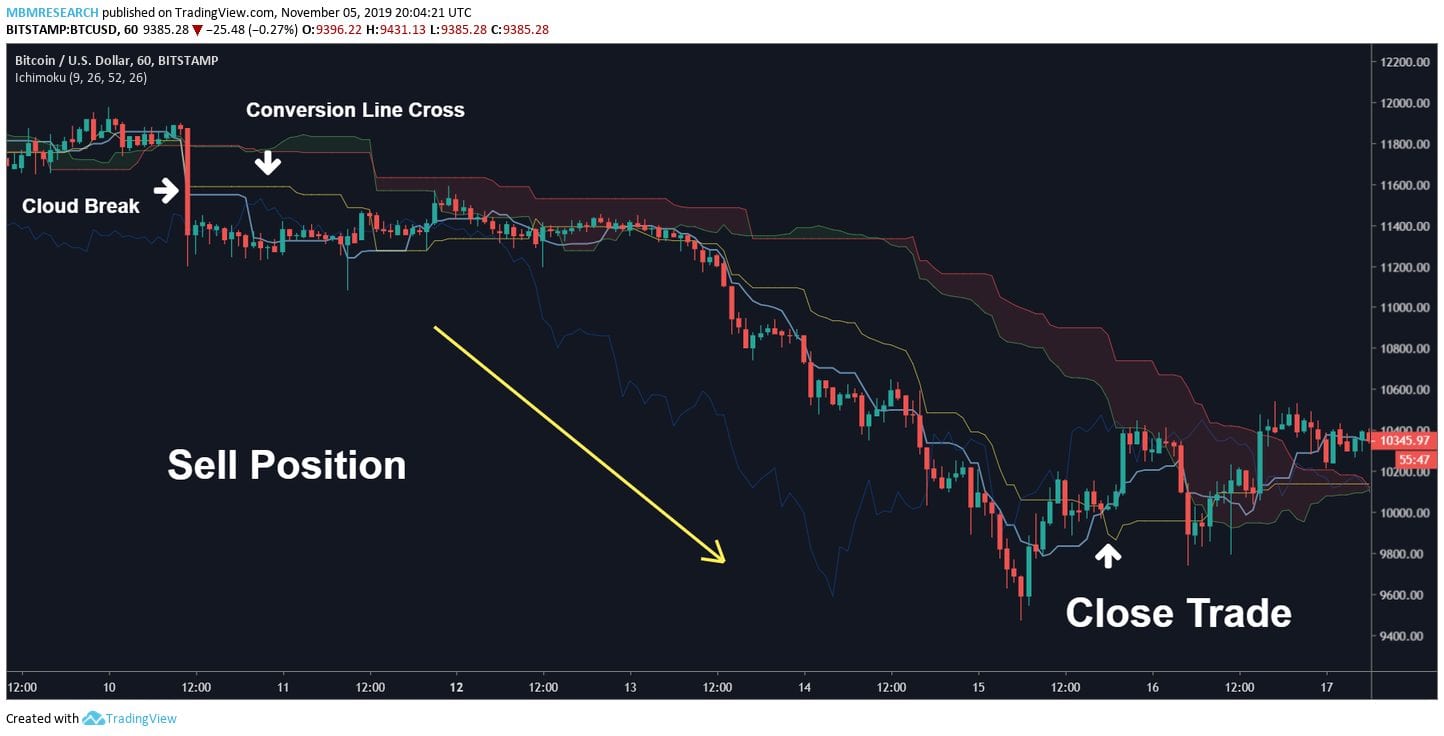
Stop loss on the trade could be placed above $12,000 as this marks a psychological price level that could contain profits. This resistance level also marks the high that preceded the bearish Cloud break on the hourly charts. To find our required price target, we can multiply the total risk of loss by 3x, which gives us a downside price target of $10,200 on the short position. Ultimately, the trade should be closed when prices move back into the Ichimoku Cloud (which is an event that is preceded by a Conversion Line crossover). Closing the trade at these levels produces an attractive profit on the short trade.
YOUR CAPITAL IS AT RISK
Ichimoku Trading Strategy – The Bottom Line
Many of the signal lines plotted using the Ichimoku system are created with moving averages, so it isn’t surprising when traders misinterpret its signals.
However, the Ichimoku system’s components are much more dynamic than what is visible on a chart that plots simple moving averages.
This is because the Ichimoku Cloud was designed to detect trend changes over multiple time intervals and identify zones of support and resistance that are likely to define future price action.
In summary, here are a few of the most critical points to remember when trading with the Ichimoku Cloud and its accompanying set of signal line indicators:
SUMMARY
- Movement in the Ichimoku Cloud identifies the long-term direction of market trends, so traders should only establish positions in the same direction as the dominant movement of the Cloud.
- However, in cases where prices are able to enter (or break through) the Cloud, the forceful movement signals potential shifts in trend momentum.
- Conversion Line movements above the Base Line often signal a new bullish trend. Conversion Line movements below the Base Line signal a bearish trend.
- During strong trends, the Ichimoku Cloud often works as a support/resistance boundary capable of containing market prices.
- Conversion Lines and Base Lines can also work as support/resistance levels during strong price trends.
- When asset prices enter the Cloud or markets are trading in a sideways range, choppy conditions are expected and the Ichimoku system loses validity (no positions should be established).
PEOPLE WHO READ THIS ALSO VIEWED:
- Here are our latest trending stories
- Trade stocks with top-rated Pepperstone
- Explore and learn bollinger bands strategy


