
The Rounding Top Pattern Explained

Image 1: EUR/USD on a 4-hour chart
The rounding top chart pattern is used in technical analysis to signal the potential end of an uptrend and consists of a rounded top (sometimes referred to as an inverse saucer) and a neckline support level where price failed to break through on numerous occasions. This chart pattern is considered complete once price finally breaks and closes below the neckline.
The rounding top pattern can sometimes coincide with a double or triple top pattern but the main point to consider here is that a potential change in trend could occur and that traders should exercise caution if they are holding long positions and perhaps even prepare to go short once price breaks below the neckline support level.
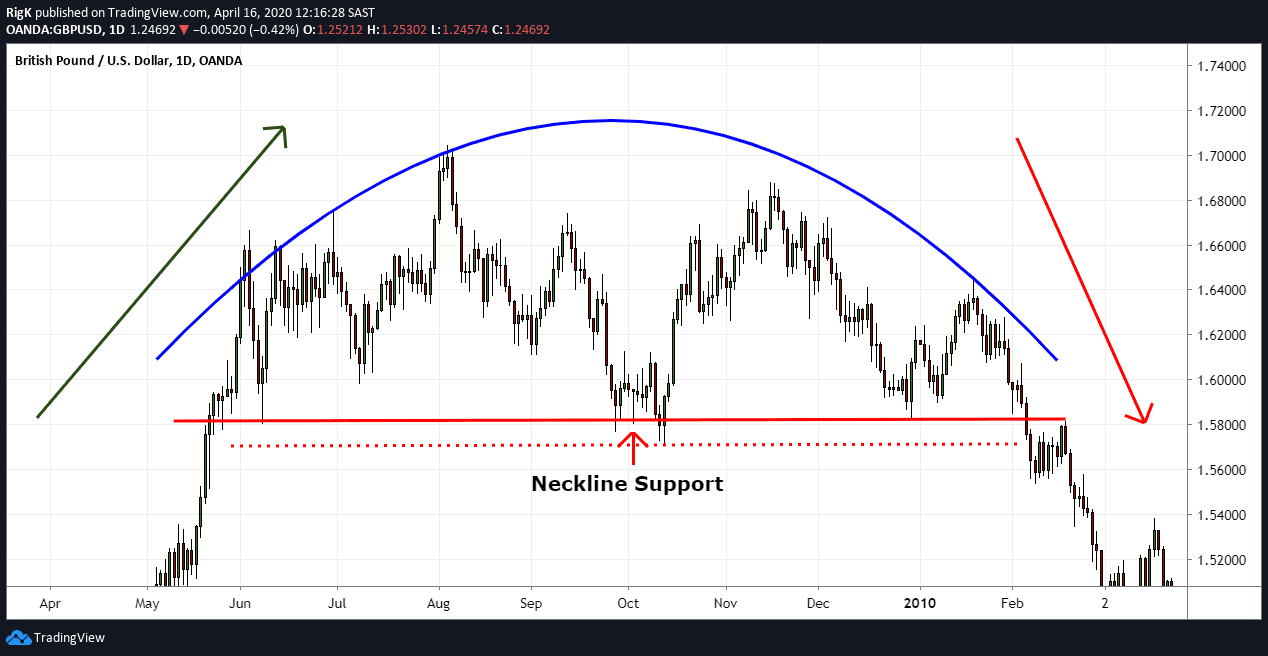
Image 2: GBP/USD on a Daily chart
Here we have another example of a rounding top chart pattern but this time the formation took place in the GBP/USD currency pair and took multiple months to complete. Note how price dropped sharply lower in both these examples once the neckline support level was broken. This price behaviour is a common occurrence once these patterns complete.
How to Trade the Rounding Top Pattern
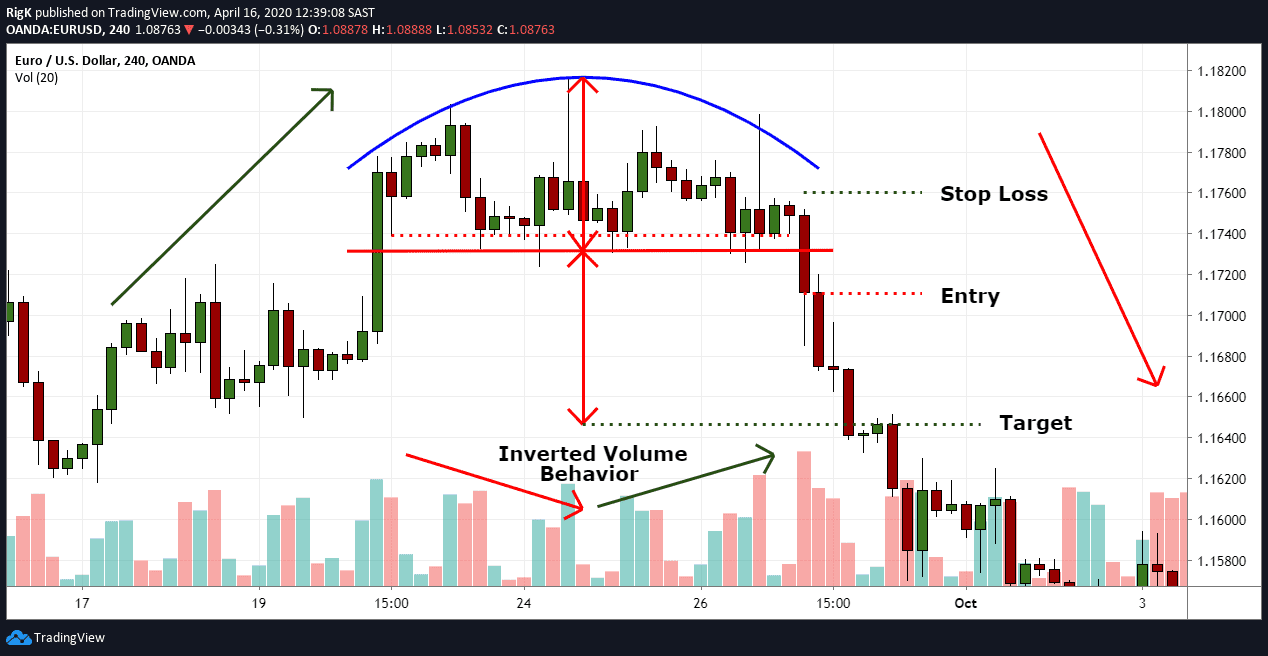
Image 3: EUR/USD on a 4-Hour chart with Volume
Aggressive traders will often enter a short position after a break and close below the neckline support level and place a target lower down that is equal to the height of the rounded top.
Conservative traders on the other hand tend to wait for a break and close below the neckline, followed by a pull-back and test of the neckline before they will enter.
Just take note that the conservative entry method might not always work out and result in a trader missing a setup, like in the example above. A stop loss can generally be placed a few pips above a swing high that occurred before the breakout.
Traders Tip: Keep an eye on how volume behaves during this pattern formation because the volume will often have an inverse relation to what price is doing i.e. first dropping and then rising before the pattern completes.
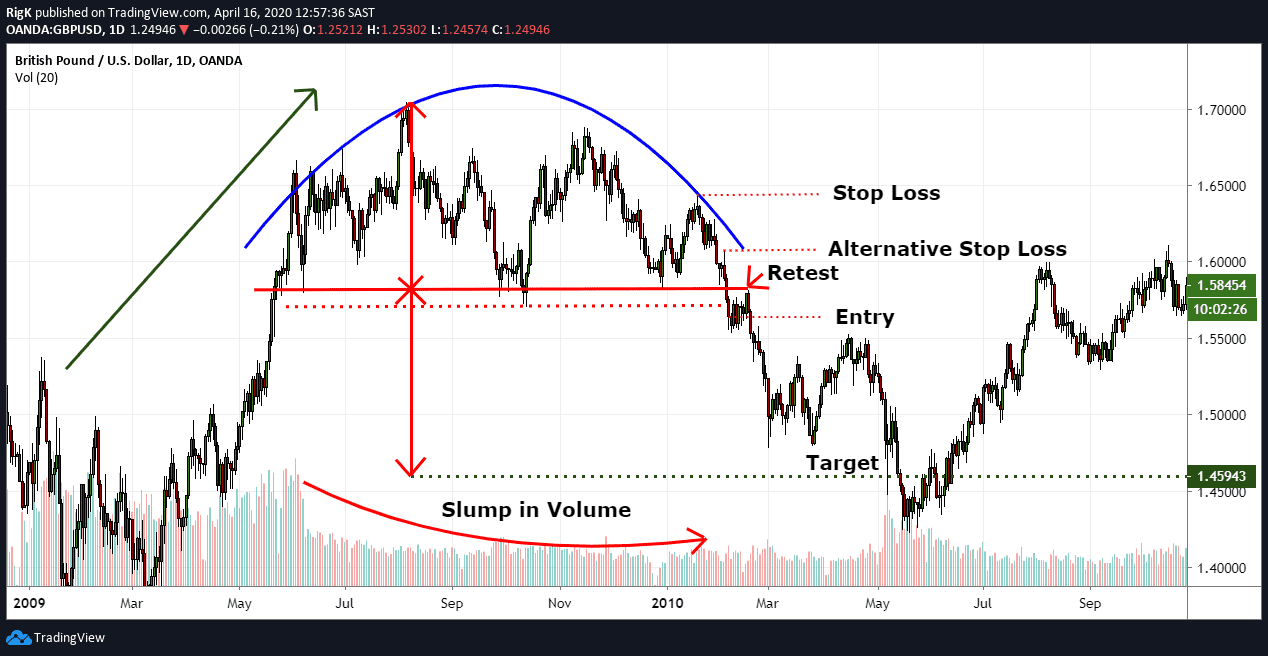
Image 4: GBP/USD on a Daily chart with Volume
My final chart shows the same long-term rounded top pattern that occurred in GBP/USD and how both aggressive and conservative entry methods would have worked in this example.
In this example, volume experienced a huge slump during the pattern formation, even when price peaked the volume stayed low which was an early indication that the buying pressure was thinning out and that a turn lower was highly probable.
Important: Your risk versus reward potential is one of the most important factors to consider as a trader. The chart above shows that your reward potential would not have been that great if you placed your stop loss above the previous swing high. Placing a stop loss above a previous candle’s high instead could have been an alternative approach.
Rounding top patterns indicate that a trend reversal is highly likely, especially when volume behaves as it did during the above examples. The next time you encounter one of these patterns, be careful if you are holding a long position or prepare to get short once the pattern ends.
PEOPLE WHO READ THIS ALSO VIEWED: